Audit your content and SEO with our content strategy tool to get more from your content marketing
One of the biggest appeals of digital marketing is that it's data-driven - we can readily review the effectiveness of our activities and make informed improvements. This is particularly true for using content marketing and SEO to attract and convert visitors to lead or sale.
Yet, the tools that are available within analytics to help us visualize and optimize our content haven't really changed since I've been involved in digital marketing.
If you dig into the Behaviour reports in Google Analytics you still see long lists of Top Content and Landing pages to try to interpret. Using content groups in Google Analytics can help simplify by grouping related content.
Although you can sort the lists, it's not easy to identify which content is performing well and can be enhanced and which is under-performing and which can be.
Analyze your content as a portfolio of assets to optimize
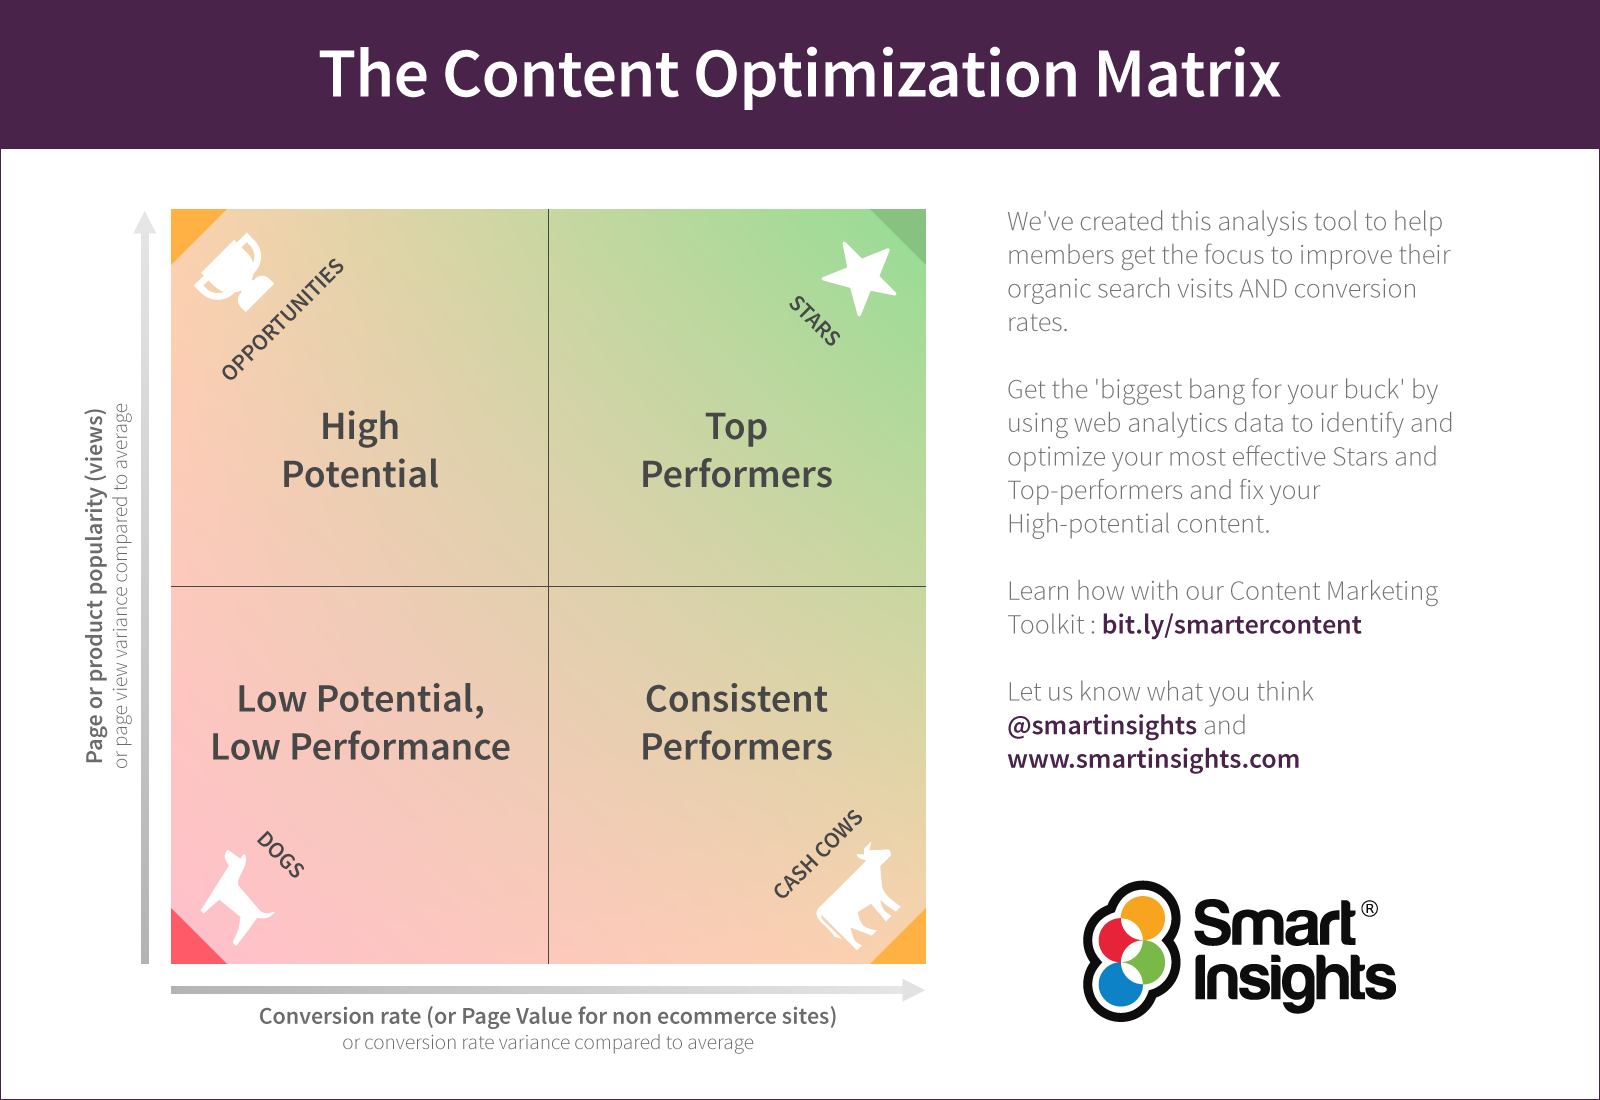
I've designed our Content Optimization Matrix to help marketers audit the potential for businesses to get more from their content by giving a simple way to visualize the content you should focus on improving to increase reach and conversion. I see the content types and individual content assets on any site as a portfolio where some content will contribute a lot to the business, other types a lot less and some with the potential to contribute more.
How to use the Content Optimization Matrix?
For me, content optimization is about making your existing content work harder for you. I'm a fan of applying the 70:20:10 rule in marketing (or if you prefer the 80:20 rule) to focus time for improvement and optimization on what will make the biggest difference.
I recommend spending 70% of your time optimizing and promoting your Top Performers and creating more evergreen or cornerstone content i.e. create new content like this.
20% of your time should go into working to improve under-performing content with potential to contribute more such as Consistent Performers and High Potential content.
Any remaining time can go into reviewing how to improve the Low Potential, Low Performance content or perhaps better, creating less of this content and brainstorming ideas to create more engaging, more effective content.
Get your content optimiztion strategy right
Before looking at the four quadrants in more detail, to use this matrix or a variant of it, you need to define what effective content is. The Content Optimization Matrix helps you focus on which are the best content effectiveness measures since you can only display two value to plot content assets on the matrix (although with colour or size of circle as in the example below where bounce rate is shown by the size of the circle) you can layer on more information. Here the two main measures are:
- Popularity of content - we simply measure how many people view the content on site based on the number of page views. We plot this on the vertical axis so pages or content groups with the most page views are at the top. This content will be popular for a combination of reasons, i.e. it pulls organic traffic, has paid media pointed at it or it is prominent within the customer journey. In our case, it is mainly because of organic search.
- Marketing effectiveness of content - how relatively strong is the content at converting visitors to lead or sale. For transactional e-commerce businesses like retail, travel or financial services this is straightforward, it's the conversion rate for sale. For many other types of business, e.g. B2B or B2C services businesses who don't sell on site, this is a lot less clear. Publishers or brands with less clear conversion outcomes can use alternative measures of engagement such as dwell time to assess the value of content to themselves or their readers. But how do you measure lead value in Google Analytics? Long story short, you need to define goals in Google Analytics which you place a value against, e.g. value per lead so that you can view page value in Google Analytics. This doesn't have to be a precise measure since we are simply looking at the relative value of content on the matrix. See our 7 Steps guide to Improving digital marketing with Google Analytics for the details.
Once your content is plotted on the matrix, you can identify content that is already working for you and then you can review tactics to:
- Position this content more prominently in the customer journey to increase leads or sales e.g. feature it in relevant calls-to-action or panels
- Update the content to make it more effective for SEO (if it is attracting good organic traffic) or more effective for conversion (if it is already converting well).
Here is the full walk-through. You can see we have applied the well-known labels from the BCG matrix which applies a similar portfolio review to markets rather than content.
Top performing content - Stars - highest reach, highest conversion rate
This is your most effective 'hero' or 'evergreen' content which attracts the most visits since it attracts organically visits through inbound marketing or you promote it heavily through paid media. It is also the most effective content relatively speaking in converting visits to value measured as leads, sales or engagement. You will often need to work hard to get more value from this content by keeping it visible in the SERPs if that is the main traffic driver. Options to make improvements in this quadrant include:
- Historical Optimization - updating content so it stays fresh by updating with the latest information or extending it so it remains effective in the SERPs
- Surfacing popular content - featuring the content (or products) more prominently in the customer journey, for example in panels or resources sections
- Create related content - writing related content articles that build on and link back to the main theme
This article gives an example of how HubSpot has used what they call ‘Historical optimization’ to more than double the number of monthly leads generated by the old posts they have optimized, they also increased monthly organic search views of old posts, optimized by an average of 106%.
High potential content - Opportunities - highest volume, lower conversion rates
This content is successful in attracting visits, but for some reason has lower conversion rates and often higher bounce rates than Top Performers. To get more from this content, consider:
- Improving calls-to-action - make them clearer and more compelling or simply add more in-line links if it's a blog post.
- Improving the content quality - Low conversion could be a problem with the content itself, perhaps the content is too short, so isn't engaging. A retail merchandiser told me an example of where a beauty treatment product was getting great views, but lousy conversion, the reason was simply found to be a poor product shot which was easily remedied.
- The target audience - If none of these techniques give improvements, perhaps the content is attracting the wrong type of audience.
Consistent performers - Cash Cows - lowest reach, highest conversion rates
This content is effective in conversion, but not in attracting visits. Options here include:
- Increase visits using SEO - Reviewing content against SEO best practices for on-page optimization and internal and external backlinks
- Share content regularly - ensure it's in the editorial calendar to share via social media or in e-newsletters or via partners
- Paid media - use paid media to attract more visits to the content
Low potential/low performance - Dogs - lowest volume, lowest conversion rates
Perhaps 'Dogs' is overstating it, this is simply your average content, it can still have an impact on attracting visits through inbound marketing as long-tail content and can influence conversion, it's simply not stellar, so is less worth optimising individual content, although groups of content or page templates hosting them can be improved.
How to create the Content Optimization Matrix using analytics data
At Smart Insights, we have adopted Google's Data Studio for our monthly and weekly trading reports alongside the Google Sheets Add-In for the Google Analytics API which we use for pulling the data through for our RACE digital marketing dashboard.
Data Studio can create the visualization needed which was never really possible in Google Analytics. Here's an example showing the large range of content values we have for page value and page views (outliers omitted).
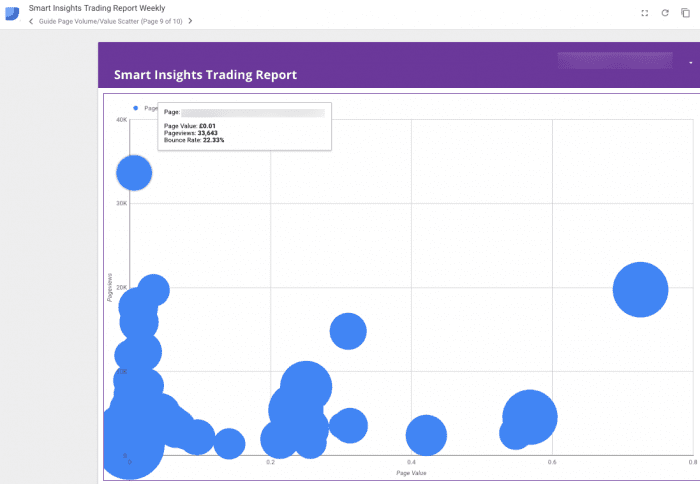
As you'd expect, the bulk of the content is in the Dogs section, but this means that it is relatively easy to focus on improvements from the other three quadrants!
Have you seen our other content marketing audit tools?
You can see we're big fans of content marketing and tools to review and improve it. This matrix is the third in the series that I've had on my mind for a long while. Dan Bosomworth and I introduced the original Content Marketing Matrix in 2014 which helps select the right types of content to support the buyer journey. Then spurred on by the shares, comments and mashups from that in 2015, I created the Content Distribution Matrix which gives a top-level tool you can use in workshops to discuss the review the returns you get from content and media effectiveness.
Recommended member content - Quick Win on Content Auditing
Learn techniques to optimize your content assets to increase leads and sales.
Access the 360 degree content marketing audit