Depending on what business you’re in, typically anywhere from 2%-15% of your online visitors convert into customers. That means 85%-98% don’t. So, wouldn’t you like to know why?
You can, by gathering some critical customer feedback with some very affordable methods and tools. Best of all, all of these analyses can be done for less than $1000 (USD).
I call this ‘taking the pulse’ of your prospects and customers — from two angles, and using multiple methods. By two angles I mean doing both quantitative and qualitative analysis. And the methods include:
- Reviewing your analytics data
- Reviewing your visitor clickstream data
- Gathering ‘voice of customer’ data
- Running an eye-tracking study
- Launching a one-question poll
- Getting expert conversion review
Ready to achieve customer conversion growth?
Find more expert advice and strategic marketing training designed to increase your conversions and get results, fast.
Kick-start growth
Why so many methods? Well, your medical doctor doesn’t just check your blood pressure, then say, ‘OK, we’re done,’ and send you on your way. He or she would be professionally negligent for not gathering more data on your physical and mental state, such as:
- Requesting a comprehensive blood test
- Asking you some questions about your lifestyle and mood
- Referring you to specialists who can better diagnose and treat specific conditions you may have
You get my point: one data point isn’t enough to get a complete picture of a patient’s health. Similarly, with your digital experiences, the ‘patient’ is your target customer, and their ‘health’ is the quality of the experience they’re having with your brand.
Method 1: Review your web analytics data
Investment: $140 (analyst time: 2 hrs @ 70/hr)
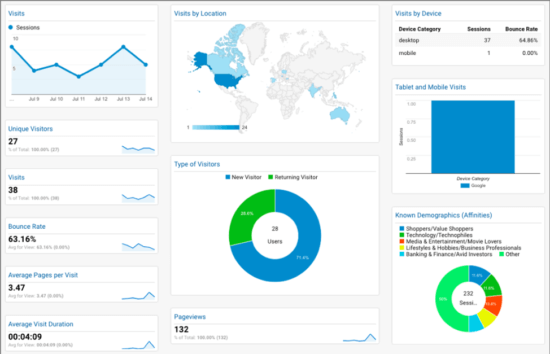
The first way, on the quantitative side, is to do a quick review of your web analytics data, whether it resides in Google Analytics (GA) or another analytics platform.
Start by looking at your high-level ‘visitor arrival’ metrics like:
- Traffic levels:
- How many monthly visitors does your site get? What percent are repeat visitors?
- What’s your traffic source breakdown (organic, paid, social, email or other)?
- Does traffic vary by season, based on marketing campaigns, or for other reasons?
- Top landing pages:
- On which pages are people entering your site?
- What are their expectations upon landing? How do these match with their intents (based on keywords or ads clicked)?
- Page paths:
- What are your most-viewed pages and click paths?
- Do these paths correspond to your conversion funnels?
Then, for each landing page and channel, review your top ‘visitor departure’ metrics:
- Early in the experience:
- What are your top ‘bounce’ pages? (visitors visit one page and leave)
- Where are users most leaving your conversion funnels?
- Closest to conversion:
- (e-commerce) Where in the checkout process are your visitors bailing?
- (SaaS/lead-gen) Where on your lead-gen forms are your visitors abandoning?
You could certainly spend a lot more time slicing and dicing your analytics data. But that deeper analytics dive can wait. This quick review of your analytics will give you the big picture of what’s happening, and a sense of the conversion ‘holes’ you need to fill.
Method 2: Review visitor clickstream analytics data
Investment: $240 (2 months subscription to LuckyOrange @ 50/month; analyst time: 2 hrs @70/hr)
Sign up for a tool like LuckyOrange, then install a small Javascript (JS) code snippet on your pages.
Depending on your site traffic, you’ll gather a critical amount of visitor clickstream data within a few days to a few weeks.
Then start reviewing the data collected, which includes:
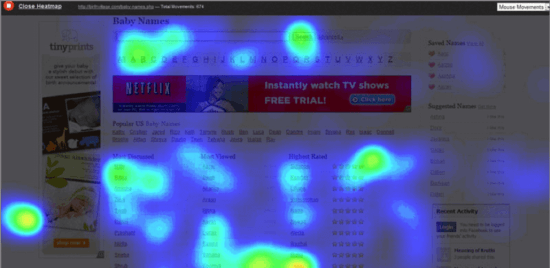
- Visitor session recordings
- Visitor heatmaps (of mouse and click paths)
- Form analytics (showing where visitors struggle and abandon)
- Survey and poll data (more about that later)
- Online chat (if you set it up)
- Conversion funnels
From these analytics, you’ll quickly learn whether your visitors’ usage patterns match your design intentions and, based on their poll responses and chat questions, what your visitors really want. This quantitative data is vital for understanding your customers' experience.
Method 3: Run an eye-tracking analysis
Investment: $200 (1 month subscription to RealEye @ 60/month; analyst time: 2 hrs @ 70/hr)
As Willie Shakespeare famously said, "The eyes are the window to your soul". More importantly, from a conversion perspective, the eyes are a window into what your visitors are actually paying attention to. Of course, the content and images they focus on should be driving them to take that conversion action.

Only a couple of years ago, you had to pay $2000 or more for a hardware and software application for eye tracking. And you often needed the help of a consultation to make sure everything was set up and working properly.
No more. Now you can use a cloud-hosted, webcam-based eye-tracking app from a vendor like RealEye. You can complete the setup within about 20 minutes, then post screenshots of the designs you want people to scan. Then participants, after a 60-second calibration check, scan the pages as they normally would, and the platform tracks their eye movements.
Eye-tracking data to understand your customer:
- Analyze the scan recordings for each user
- Review aggregate (heatmap-like) images showing which elements drew the most attention
These scan patterns give you yet another quantitative insight into what aspects of your marketing are working, and which are wasted.
Method 4: Gather ‘amplified’ voice of customer data
Investment: $280 (analyst time: 4 hrs @ 70/hr; 0 tool cost)
I call customer service and sales reps my voice of customer data ‘amplifiers.’ That’s because they speak with dozens of prospects and customers every day. So, when I speak with them, I’m getting their insights from hundreds of customer interactions at one time.
Ask customer-facing colleagues about your customers:
- What do customers most complain about relative to a) our product/service, and b) the experience we deliver?
- What do our customers most like about our a) product/service or b) the experience we deliver?
- If you, based on what you’ve heard from our customers, could fix just three aspects of our website or digital marketing, what would they be? What do you feel must be fixed first?
Observing support and sales reps while they work — also called ‘shadowing’ — is just what it sounds like. After getting the ‘ok’ to sit with them and wear a headset, you just shut up, listen and make notes of what you’re hearing, along with emotions expressed.
I’m speaking mostly of e-commerce support reps here. But if you work in a B2B or SaaS business, the same approach applies. It’s just that, instead of talking with and observing CSRs, you should spend time with Account Executives.
True, these reps are typically very busy. But you’ll likely find that, if you first reach out to the Support or Sales supervisor to get their permission, you’ll soon be able to schedule time to sit with reps. The Supervisor may even schedule the interview times for you.
How to increase your website leads
Delve into data-driven and UX proven analysis and persuasive techniques to convert your website visitors into qualified prospects and buying customers. Using forward and reverse path analysis in Google Analytics, you can follow our step-by-step recommendations to learn practical techniques to increase your leads.
Access the 3 techniques to increase your website leads
Method 5: Launch a one-question poll
Investment: 140 (analyst time: 2 hrs @ $70/hr; 0 tool cost [polling included with LuckyOrange])
You’ve already got your visitor analytics app installed, so why not use another one of its key features: the ability to run customer feedback polls.
These aren’t the long-winded customer feedback surveys that annoy me as I surf the Web these days. No, they’re the single-question polls that occasionally appear in the bottom portion of your screen.
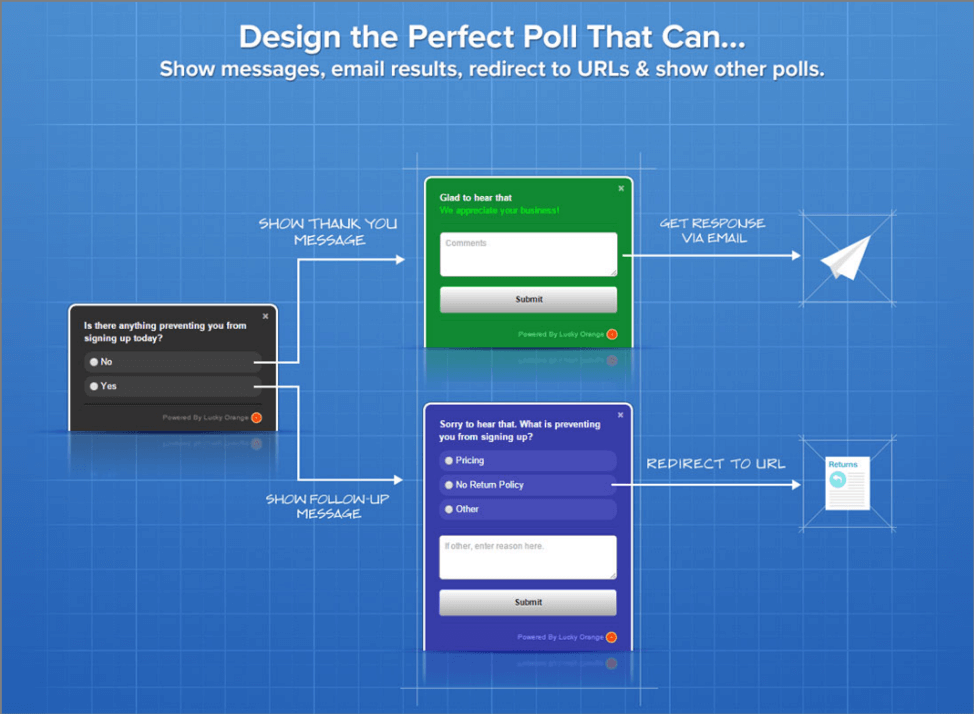
To run a one-question poll, first decide what question to ask, then configure when and where to push the question to your visitors.
Limit yourself to one question, with an optional follow-up question. Ensure that you’re asking a) the right question, b) at the right place and time, c) to the right proportion of visitors, and d) in a way that doesn’t interfere with your live chat (if you have that installed).
The answers to this question will tell you how well what you thought your visitors were seeking matches up with your acquisition marketing assumptions (keywords, ad copy, etc.). And you’ll have gathered some valuable qualitative data in the form of verbal comments.
Choose your poll question carefully
Your question choice should depend on whether you most want to a) learn visitor intents or b) expose visitor objections. To learn intents, ask things like:
- ‘What brings you to our website today?’
OR
- ‘What are you looking for today?’
On your top landing pages, you should:
- Tailor your intent-based questions to the visitor context (the search results or paid ad the user clicked before arriving here).
- Ask your question after some time has elapsed (20 sec is a good general rule), so your visitor has time to get oriented and start interacting with the page.
Maybe you’re pretty clear on what your visitors are seeking when they arrive. In that case, it’s more valuable for you to ask questions further down your funnel in order to expose the ‘objections’ (fear, uncertainty and doubt) keeping your engaged visitors from taking your desired conversion action.
To expose these objections, ask questions like:
- (e-commerce) ‘What’s preventing you from completing your purchase?’ (asked, for example, after a visitor has loitered on a product page for 40 seconds).
- (SaaS) ‘Any questions about the information you’re requesting?’ (asked, for example, when a visitor has loitered on a lead-generation form for 40 seconds).
If in doubt, ask yourself: would I ask a real person this question at this time? Then let your answer be your guide.
Some poll best practices
A few best practices to keep in mind for feedback polls. First, it’s best not to run these on mobile devices, at least for now, since the poll layers ‘eclipse’ too much of the screen. Second, take care not to interrupt your visitors at the wrong times (and thus annoy them). Third, always give the user control by ‘minimize’ and ‘maximize’ controls for your polling window.
You don’t need to serve this question to 100% of your visitors, especially if you have a higher-traffic site. Push it a lower percentage of visitors, but a level that still allows you to collect hundreds of responses within a reasonable time. (In your ‘data collection time’ calculation, assume a typical 3% visitor response rate.)
Finally, if you’re also running a live chat on your site, take care not to roll out polls that conflict with your proactive (pushed) chat layers.
If you want to invest in customer data...
If you used all of the above ways to gather quant and qual customer data, you’ve spent about $1000. That’s a modest amount compared to your UX design and development budget, and the opportunity cost of pushing out the wrong UX updates.
If you’re willing to invest further in your customer insights investment, I’ve found the following method to be a perfect complement to the analysis you’ve already done.
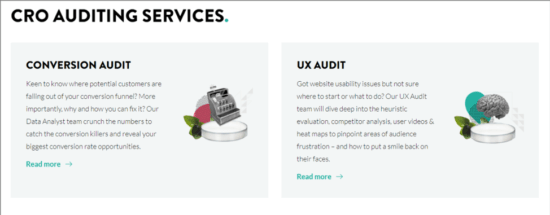
(BONUS) Method 6: Getting an expert conversion audit
Investment: $980 (analyst time: 7 hrs @ $140/hr)
I’ll admit I’m slightly biased, but I’m a big fan of complementing your quant and qual data with a Conversion Audit by a UX or Conversion Rate Optimization (CRO) expert. Going back to the doctor analogy, it’s like getting a ‘second opinion’ on your primary care doctor’s diagnosis.
To make sure you’re in fact getting an ‘expert’ perspective, seek an analyst or strategist who:
- Has worked in the UX or CRO field for 5 or more years
- Intimately knows UX best practices (both desktop and mobile)
- Has witnessed 200 or more user test sessions
- Has read a lot about psychology (and/or ‘neuromarketing’)
- Has two or more certifications related to:
- User experience (UX)
- Conversion Rate Optimization (CRO)
- Conversion copywriting
- Digital marketing
In your ‘conversion audit insights’ report you should expect to get, at a minimum:
- A list of your conversion issues, prioritized by business impact
- Tactical fix recommendations (fixes that can be made quickly)
- Strategic recommendations (fixes that require higher investment)
- Some free ‘conversion design’ mentorship
Customer insights support data-driven decisions
Gathering a ‘critical mass’ of customer insights doesn’t cost an arm and a leg. At about $1000 (or $1980 if you include an expert conversion audit), your analysis and tool costs are very affordable.
Best of all, this modest investment reduces the risk that you’ll base important design and marketing decisions more on subjective opinions than objective data.