A how-to guide for campaign reporting with examples
One of the most important (but often overlooked) aspects of digital marketing is setting up your analytics properly. It’s a little bit technical but easy to do once you understand a few simple steps and see why it’s so important.
Being able to track where your visitors are coming from is a valuable opportunity to improve your engagement and your ROI during the campaign. Additionally, when you benchmark your campaign performance you will be able to improve your campaigns in the future, and budget more effectively. It’s worth investing a little time in analytics!
In this post, we’ll show you how to use Google Analytics to track visits to your website or landing page. This is the critical first step in being able to understand how your campaign is performing.
Once you can accurately see where your visitors are coming from, you’ll be able to build more useful reports such as “goal completions by conversion source” (e.g. how many leads or sales are coming from Bing versus Facebook), or “sales by source/medium” (using Google Analytics’ e-commerce reporting features).
Why track your marketing campaigns?
Marketers at the top of their game always want more data. When you know where your visitors are coming from and how each traffic source is converting on your site, you can make on-the-fly optimizations to your campaign and achieve better overall results.
With this campaign tracking data in hand, you’ll be able to benchmark against it when designing and budgeting for future campaigns, making your future campaigns even better. This is one form of data benchmarking, and it’s a powerful tool for any marketer.
Smart Insights recommended resources
Download Expert Member resource – 7 Steps to using Google Analytics To Improve Online Marketing
Our guide steps you through the setup stages, but focuses on how you use Google Analytics to get better business results - the missing link in most books and the Google documentation.
Access the
Download Expert Member resource – Campaign tracking code creator for Google Analytics
A simple tool to help you standardise campaign tracking codes for email, social media and display ads.
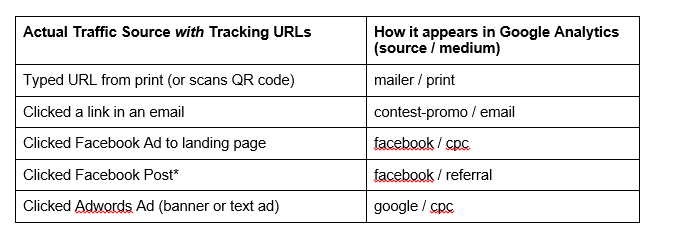
What if you not thinking this way when setting up your promotions? For example, suppose you are running a contest and you’ve promoted it through print, email, Facebook Ads, Facebook Sponsored Posts, and Google Adwords. Visitors from these sources will appear in Google Analytics as follows:
* These can show up as various sources such as m.facebook.com (Facebook’s mobile web page) and l.facebook.com (Facebook’s laptop/desktop version), depending which devices they use and if they are using http or https status.
In this example, you wouldn’t be able to distinguish visitors from print versus email. Your Facebook traffic will all show up as one stat, regardless of whether they clicked your post or an ad. Traffic from Google will all display as organic traffic, not paid traffic (cost per click).
The trouble here is that you can’t tell what the money spent on Facebook Ads or Google Adwords actually translated to in terms of leads, sales, sign-ups, etc. Did the Google Adwords spend pay off? Did anyone actually find your website through print advertising? You just won’t know. And the next time you plan a campaign, you’ll be just as blind.
But if you had known that mid-way through the campaign your Facebook Ads were converting at half the cost of visitors from Adwords, you could have applied the remainder of your Adwords budget toward Facebook Ads and boosted the overall ROI of your campaign. Or, suppose your analytics could have shown that all of your direct traffic was coming from print, and your email marketing wasn’t working - you could adjust your email messaging to get a better click-through rate there. Perhaps you are emailing to multiple lists (you should be segmenting!). Wouldn’t it be great if you could see your conversion rates for each email list separately?
You can get all of this data, and it’s easier to do than you think.
Download Expert Member resource – RACE Dashboard
The purpose of the Smart Insights dashboard is to help managers to complete a regular weekly or monthly review of the current effectiveness of their digital marketing using Google Analytics with Google Docs Spreadsheets. We use this combination ourselves in our monthly reporting! .
We’re using Google Analytics here as it’s so popular, but other analytics tools will have similar features.
When a visitor lands on your website, Google Analytics records that pageview along with the source and medium that the visitor originated from. The “source” is the domain that the visitor came from, and the “medium” is a classification for different kinds of traffic. There is also a “campaign” parameter that can be used to further segment your traffic.
Many tools like MailChimp, Hootsuite, Oktopost and Hubspot have features that let you create tracking URLs, but anyone can use Google’s own Tracking URL Builder. You can automatically apply tracking parameters to all Adwords traffic by enabling Auto-tagging in Adwords (read instructions about how it works.).
These UTM parameters (everything after the “?”) force Google Analytics to record this data into the visitor’s pageview. In your Analytics Reporting view, under Acquisition > All Traffic, you will see traffic from the above Tracking URL as:
source / medium = newsletter / email
and in the Acquisition > Campaigns report you’ll see this traffic under Campaign = agency-newsletter
Using Tracking URLs for the campaign promotion example above, we’d get this:
* using a simple URL when posting links to Facebook will report people who click the link as facebook / referral by default, but you can use UTM parameters to distinguish different campaigns if you want
The URLs below all go to the same fictitious landing page (http://example.com/), but they have different tracking parameters appended to them:
So, for each channel that you are promoting through, you should be using a unique tracking URL. This will automatically allow you to report on each channel, as well as reporting on each source, medium or campaign as an aggregate.
Important tips for measurement
1. Plan and organize your parameters
Google Analytics simply records whatever it’s told, so organize your parameters ahead of time. It’s best to use a standard set of parameters company-wide. If your company uses a different set of parameters each time an email goes out, you won’t be able to easily report on things like overall traffic from email monthly or year-over-year. Analytics is case-sensitive too, so “Email”, “email”, “e-mail” and “E-mail” will report as four separate mediums.
2. Keep it simple
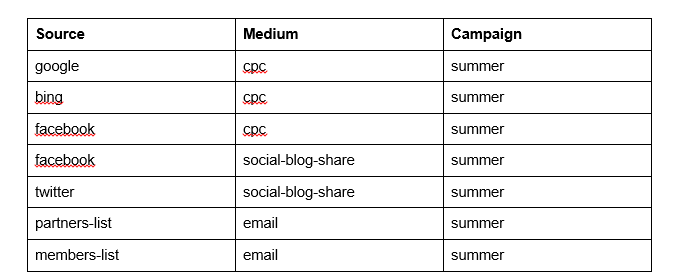
It may be tempting to create unique parameters for all of the variables for each source, but this is not necessary, nor is it ideal. Each channel only needs its own unique combination of parameters in order to be reported on separately.
For example:
These parameters will allow for reporting on all paid traffic, or all email traffic, or all traffic from the whole “summer” campaign as well as reporting on each channel separately by using combinations of the above in a segment or filter.
3. Start now
Any data is better than none. Start simple and grow from there. Optimizing your campaign strategy in response to real-time data is a powerful way to achieve better ROI for your campaigns. Benchmarking your digital marketing data over time is a sure-fire way to improve your future campaigns, too.
Watch our video
Thanks to Cory Rosenfield for sharing his advice and opinions in this post. Cory Rosenfield. Cory is the co-founder and CEO of Qoints, an adaptive digital marketing intelligence (DMI) and performance benchmarking tool for enterprise marketers. Previously, he held the role of Technical Director for multiple small-to-medium sized marketing agencies in Toronto as CSO of InfiniteSM, a social marketing consultancy and technical development firm. You can follow him on Twitter or connect on LinkedIn
By Expert commentator
This is a post we've invited from a digital marketing specialist who has agreed to share their expertise, opinions and case studies. Their details are given at the end of the article.
Strengthen your strategy with RACE-powered templates, frameworks and planning tools designed to help you review performance, identify improvements and build a more effective marketing approach.