A tutorial covering our recommended process, report, tools and KPIs to grow your business
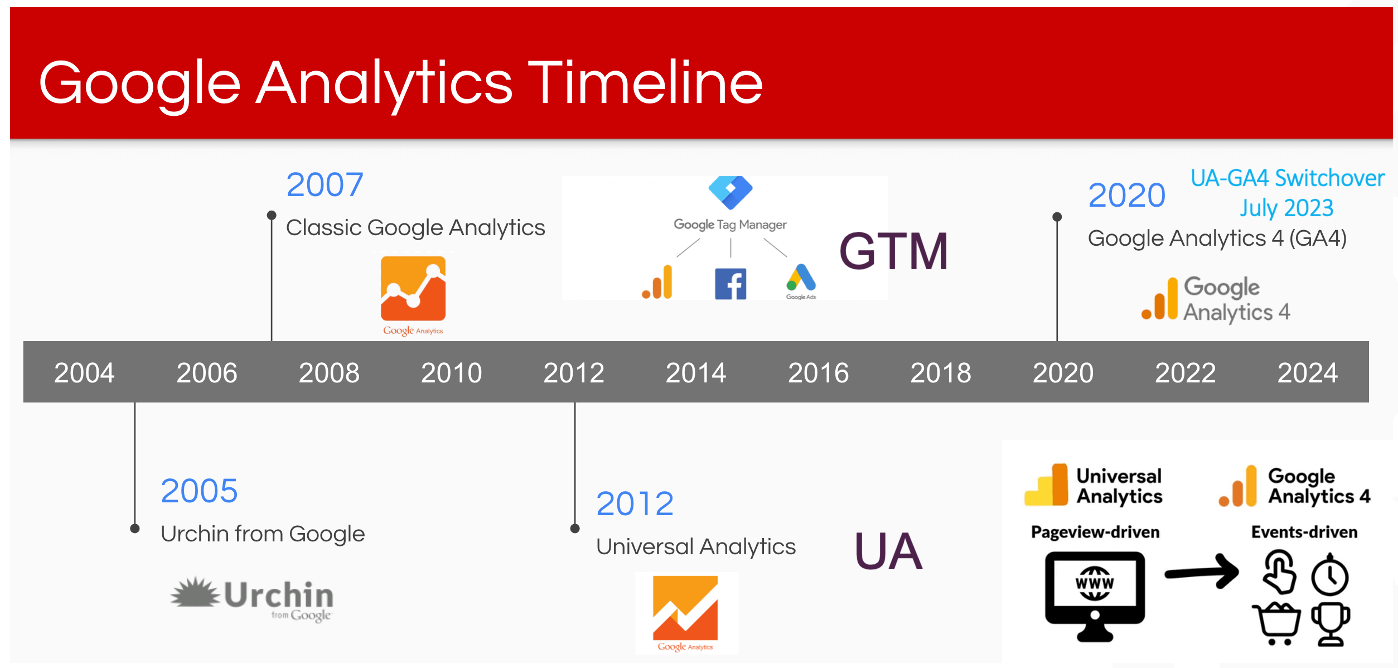
By the time you read this, it's likely that Google Analytics 3 or Universal Analytics (UA), whatever you call it, will be no more. Switching to Google Analytics 4 (GA4) presents a big challenge for any business that wants to use a data-driven approach to improving their marketing. As the timeline shows, many of us have become very familiar with UA since we may have used it over the last 10+ years.
I'm excited about switching to GA4 since, I've been using Google Analytics since it was first created, when Google acquired Urchin, centreing my consulting, training and Smart Insights learning materials and templates on it as a practical tool to help improve digital marketing using a data-driven approach.
However, the differences between GA4 and UA mean it's a BIG change and to get the most out of it, you and relevant colleagues will need to devote time to learning, ideally in a structured way. We have created our new free guide to help our members with the learning and transition process.
The challenge of GA4 is that your previous tools and techniques for analysis and reporting will no longer work as before and will need to be replaced by new, unfamiliar reports and measures. But, it's also an opportunity since the event-based data collection and reporting model of GA4 makes it possible to perform new types of analysis to identify improvements to your communications and your review and refine process to drive leads and sales.
Our free tutorial for marketers learning how to use the reporting in Google Analytics
This guide is designed to both help you learn about the most useful new features and measures and as a checklist to review the approach of how you use Google Analytics. I'll also highlight the reports and measures that matter.
What does this guide cover?
The guide is structured around ten key learnings and actions that are relevant for any business and any marketing team looking to harness GA4.
This guide is designed to both help you learn about the most useful new features and measures and as a checklist to review the approach of how you use Google Analytics.
We'll prompt you with questions to ask to check your implementation and understanding of GA4 and also highlight the reports and measures that matter.
These are the ten steps, more detail and examples are available in the guide. In this article, I cover the first 5 steps.
1. Create a plan to train yourself and/or your team on how to get the most value from GA4
As you’ll likely know, GA4 is NOT a small change from UA. The event-based data collection model is completely different to the previous page view-based data collection and the reporting interface is completely different with reports with new visualizations, labels and metrics.
To best apply GA4 to any business there are two key phases involved:
Phase A. Setup and customisation of GA4 to report on your business
Since the sunsetting of GA4 was first announced, Smart Insights has advised on customizations and have provided a detailed checklist on what needs to be changed - this is our GA4 setup audit checklist.
There are many details to consider here, but one particular ‘gotcha’ we flag up in the guide is the Data retention settings.
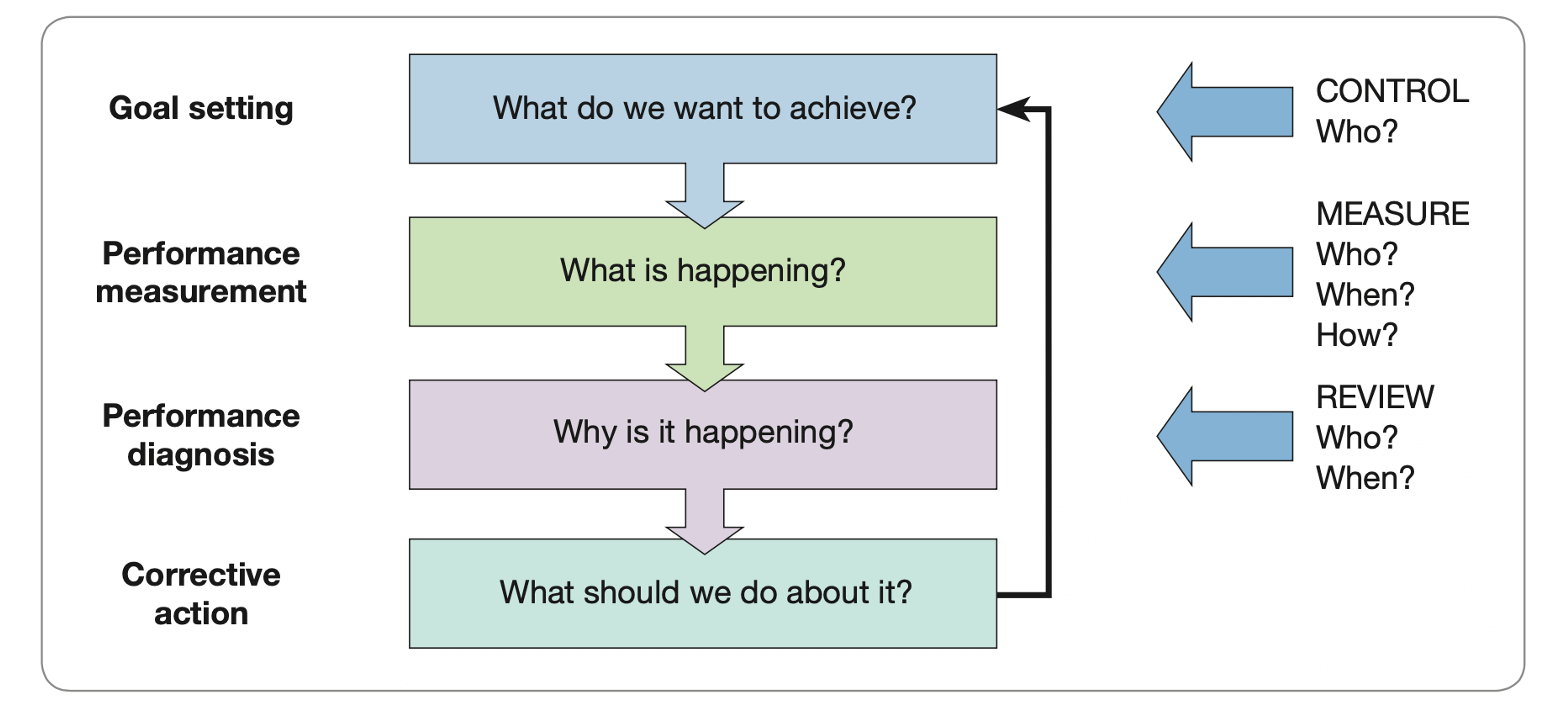
Phase B. Improving your process of using the standard reports and customization to review and refine your communications
This phase is more focused on education and learning for marketing teams. Training should focus on how to use GA4 to support marketing activities. It should enable marketers to be able to work through this process and answer these questions as part of their regular reporting of their always-on and campaign communications.
Since many businesses have now set up GA4 properties and completed or are refining their customizations, this guide focuses on the second phase that many businesses are now grappling with.
For our Business members, we give a structured learning approach for applying GA4 for both phases in our interactive Google Analytics Learning Path.
Our Learning Path uses many examples from the Google Demo account that we recommend anyone looking to learn GA4 adds as a favourite to their Google Analytics account as a cross-reference of what is possible. This account uses a merchandise store as the source of its data. I’ll also use this example in this post. We’ll see that it doesn’t always illustrate best practices.
Differences between UA and GA4
In the guide, we explain the main differences between the different versions of Google Analytics which should be considered when planning education and training for GA4.
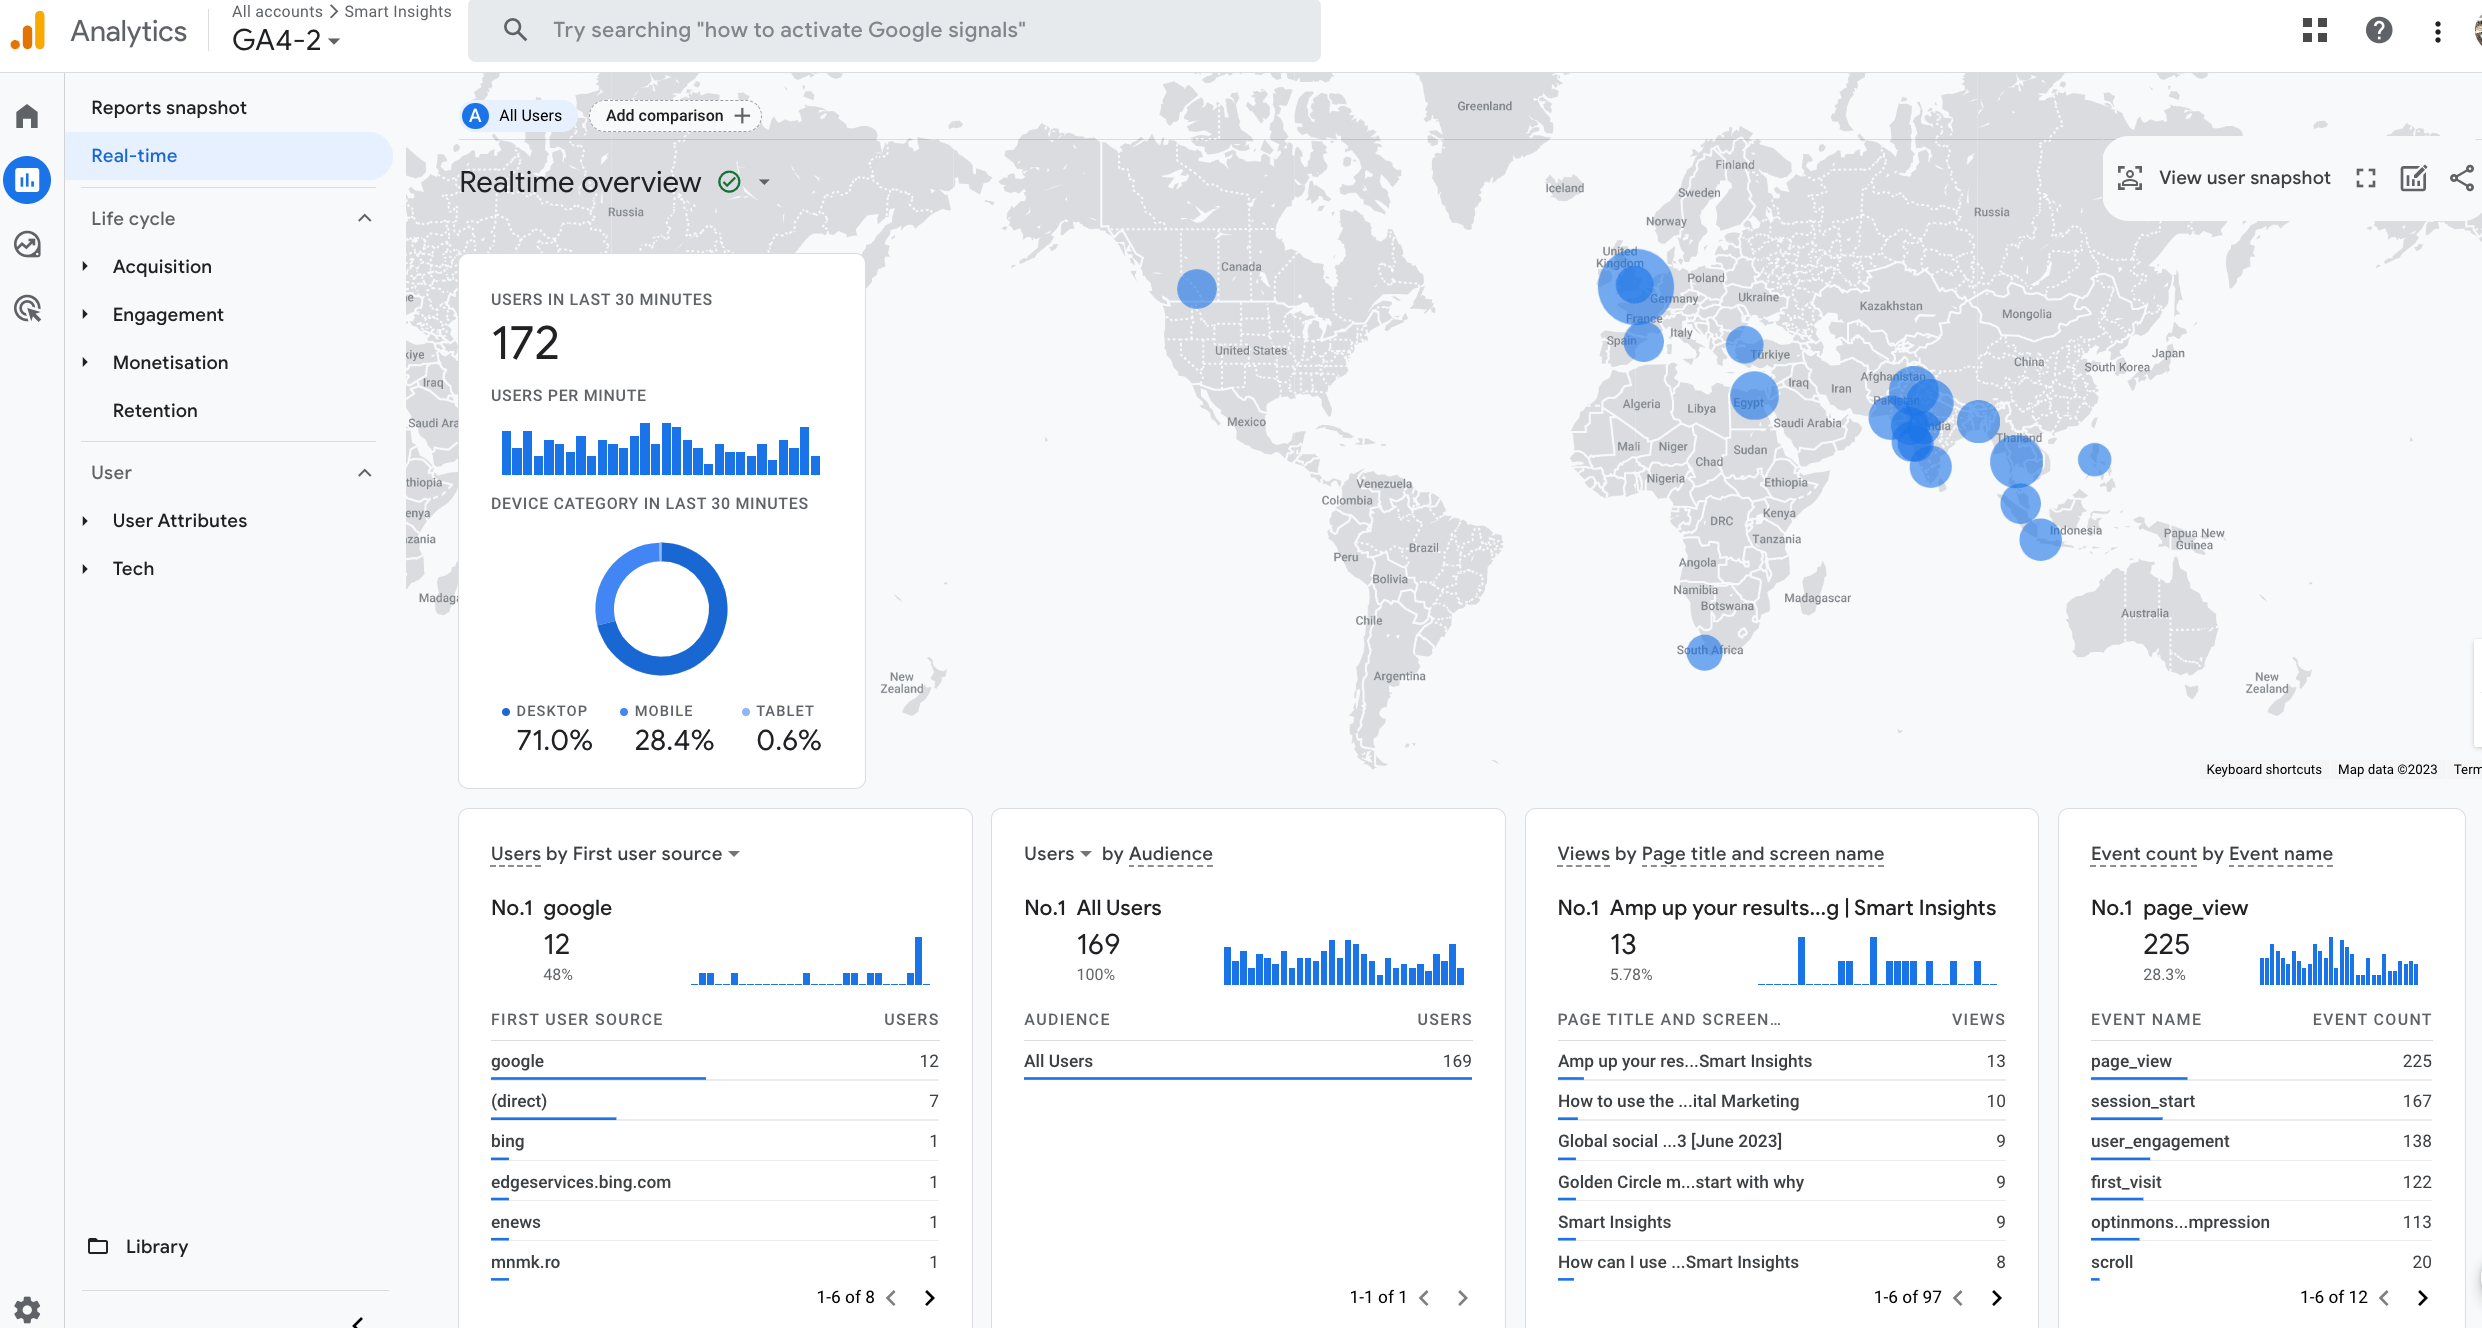
The main difference is that GA4 uses a Different data collection model – GA4 is based on an event-based rather than pageview-based measures and a new property needs to be set up within GA Admin to collect website data via a data stream using Tags which within your HTML page header which can be defined in Google Analytics or Google Tag Manager which we recommend for customization.
You can gain an idea of the Event-based tracking by viewing the Real Time tracking, shown here for Smart Insights.
In the guide, we summarize the main events you need to learn and check are set up.
2. Customize conversions for your business
In Universal Analytics there were 5 different types of Goals that were used to track key business outcomes such as leads generated or sales. In GA4, there is a single type, Conversion Events which you or your tech helpers have to set up and customize as explained in our learning path.
Advanced Module
Auditing Google Analytics customizations
Part of the Google Analytics Toolkit
Learn how to audit and set up your Google Analytics account to get clean data and customize reporting for your business
GA4 has many standard events such as page views, first_visit and user_engagement to which you can add your own events such as lead_generated or user_logged_on. Since there are many events that appear across many reports, one of the first things that a business should do is to agree on their custom events and to simplify to those that are relevant for your business as conversions.
To summarize, the process of assessing your set up of Conversion Events is:
Understand standard GA4 Events
Set up your own custom events (e.g. for leads)
Agree which of the custom events should be conversions
Mark relevant standard and custom events as conversions in the Admin section
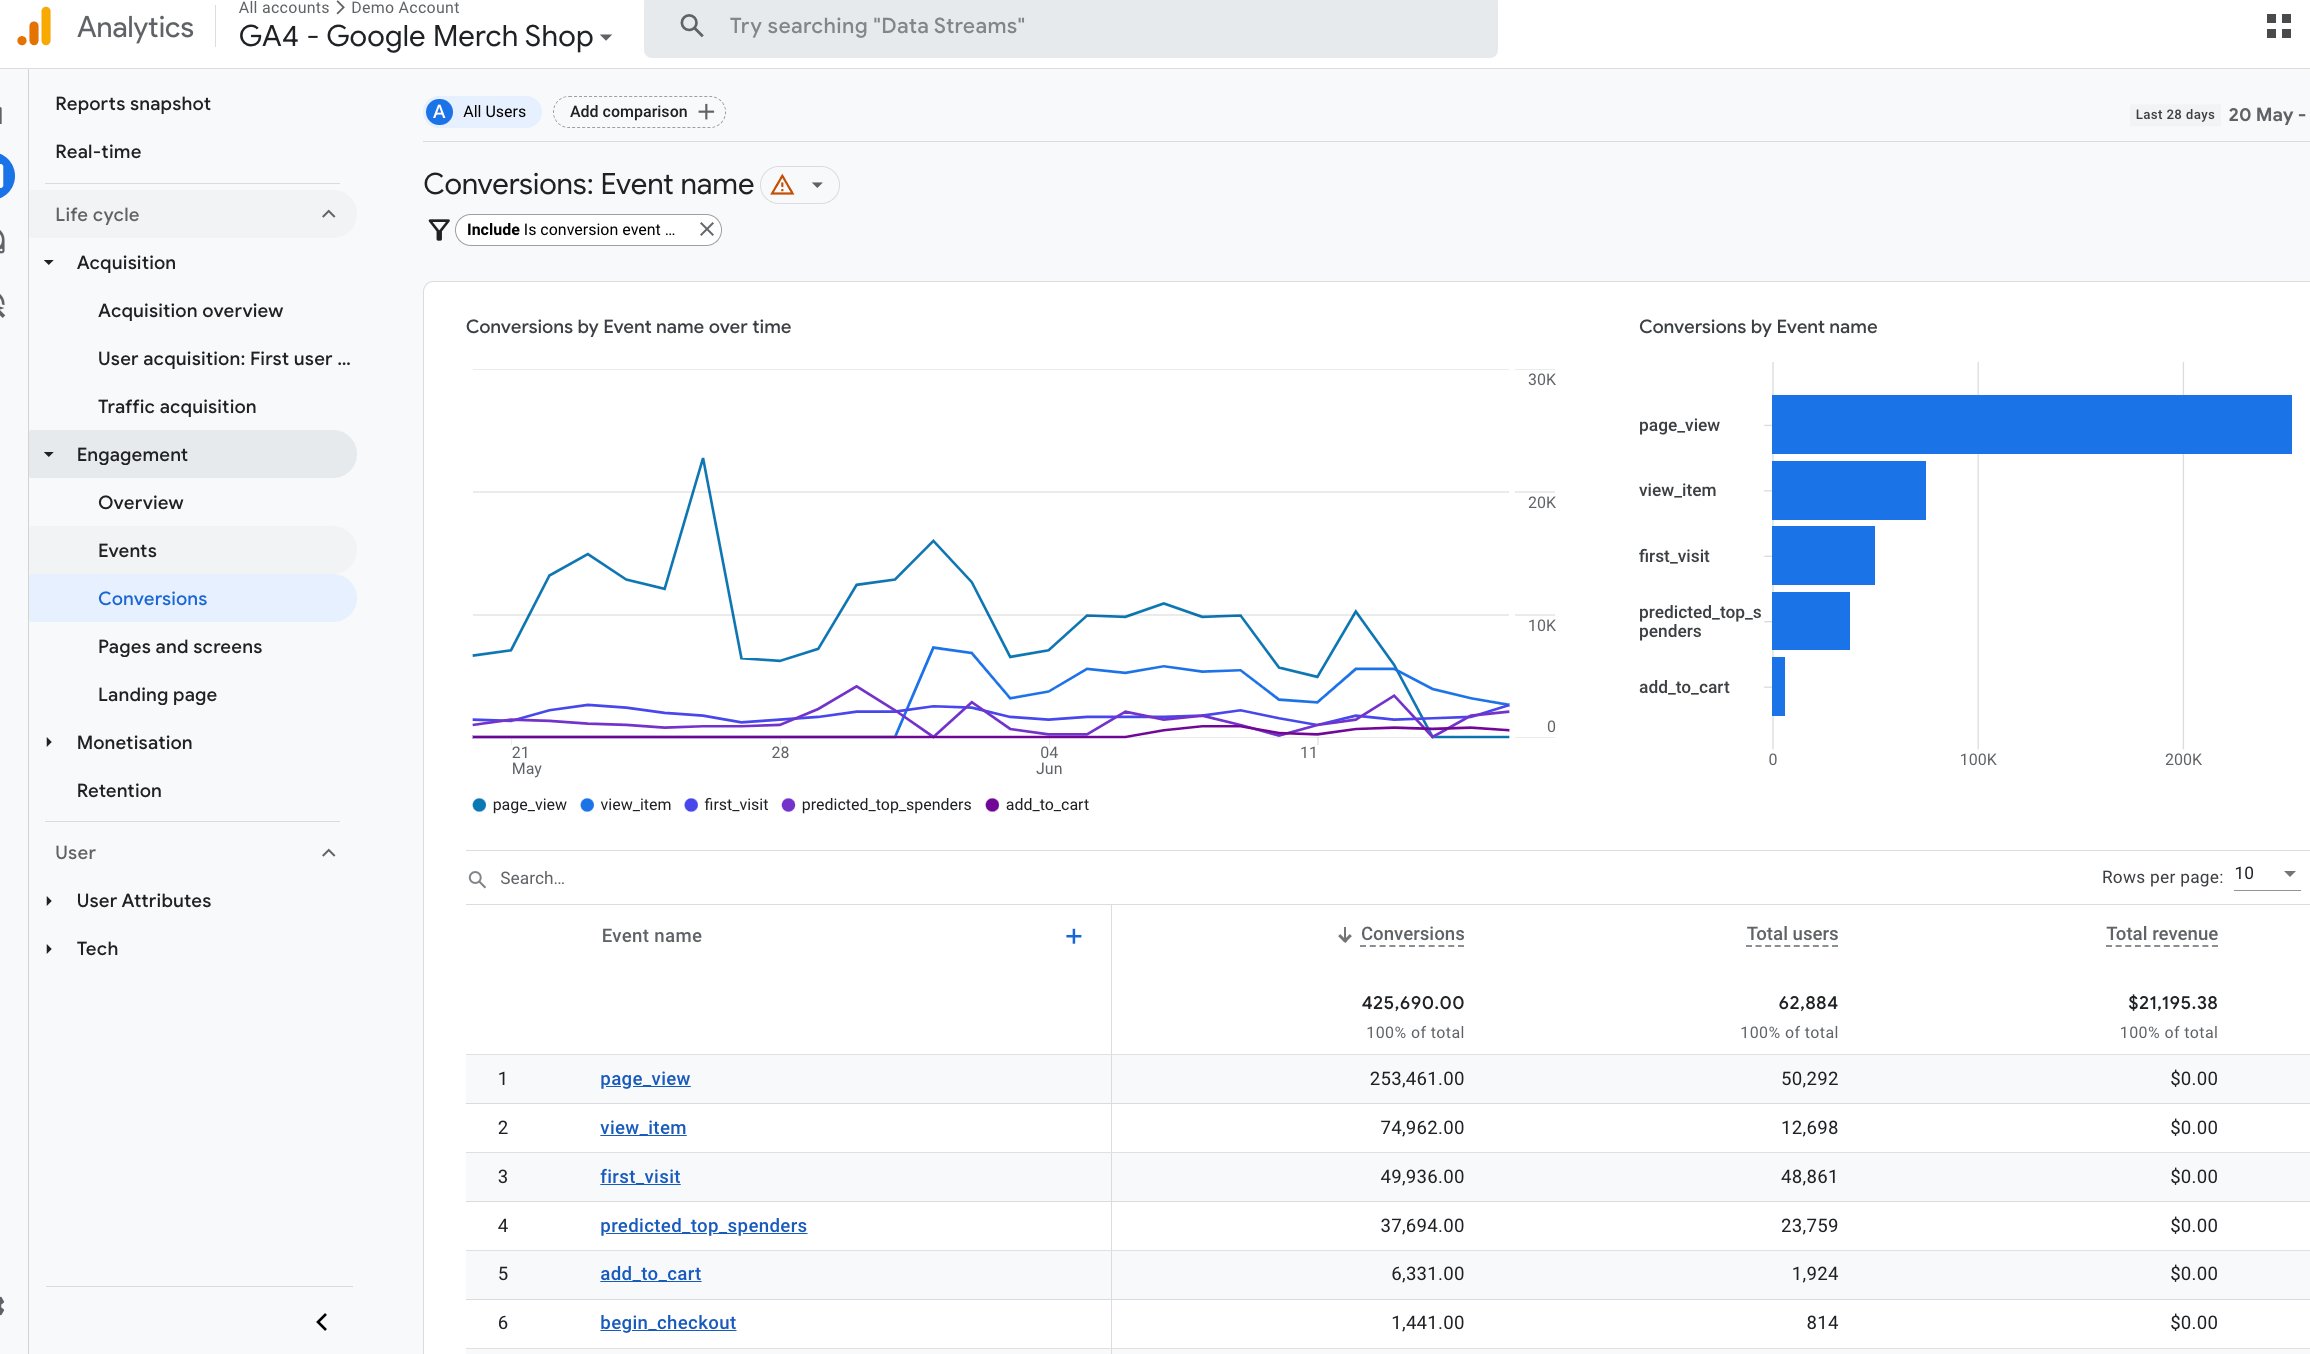
If you’re not sure what has been agreed in your business, your first point of call should be the list of conversions. You can then compare to Events. Looking at the Google Demo account we can see some Events that have correctly been set as conversions such as the E-commerce events add_to_cart and begin_checkout. However, other events such as page_view and first_visit have been marked as conversions which isn't logical...
3. Measure your high-value audiences
Not all website visitors are equal… In our learning modules which are structured around our RACE Marketing planning framework, I explain how to go beyond reviewing the volume of visitors and considering measures to assess their value, quality and cost (the VQVC mnemonic from my training).
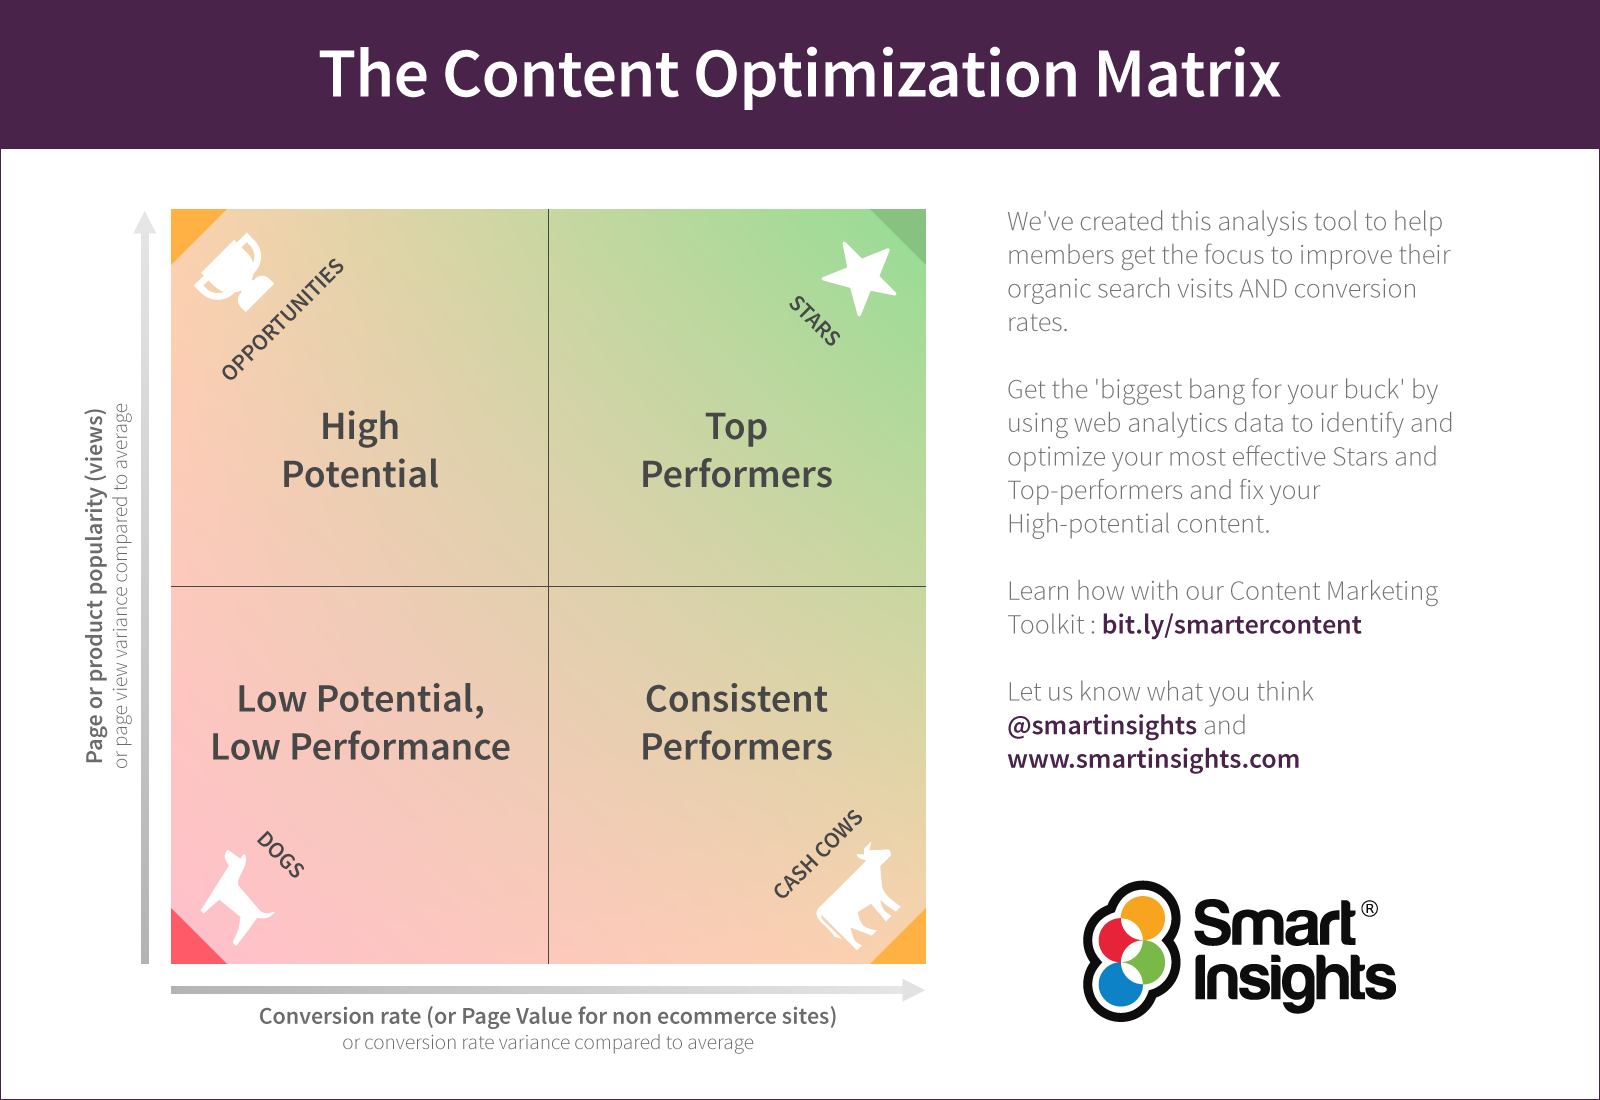
Quality of visitors is based on the proportion who engage with the content and then go on to convert. Conversion rates naturally for different traffic sources and different landing pages on the site and it’s vital to digital marketing to compare this variation to boost conversion.
We recommend that you use your analytics reporting to build up this picture shown as our content optimization matrix. This will show you your most and least effective content so that you can boost conversions.
High-value audiences also deserve special ‘VIP communications’. GA4 and Google Tag Manager make it easier than ever to create audiences to retarget using Google Analytics remarketing or other media platforms like paid social remarketing to boost conversion. GA4 is an opportunity to review your approach to optimization. Email marketing and on site retargeting through personalized panels can also be used for retargeting and GA should ideally be able to report on these.
4. Create performance review dashboards
One of the first things you notice in GA4 is that there are fewer reports than UA. Although simplification sounds a good thing, there is no new support for dashboards. In particular, what is vital for data-driven reviews as part of 90-day planning is year-on-year performance review of channels and content.
GA4 is a great, free service, with improvements to enable you to customize detail reports, for example, to add in conversion rates to the standard reports, but it still contains many metrics and reports.
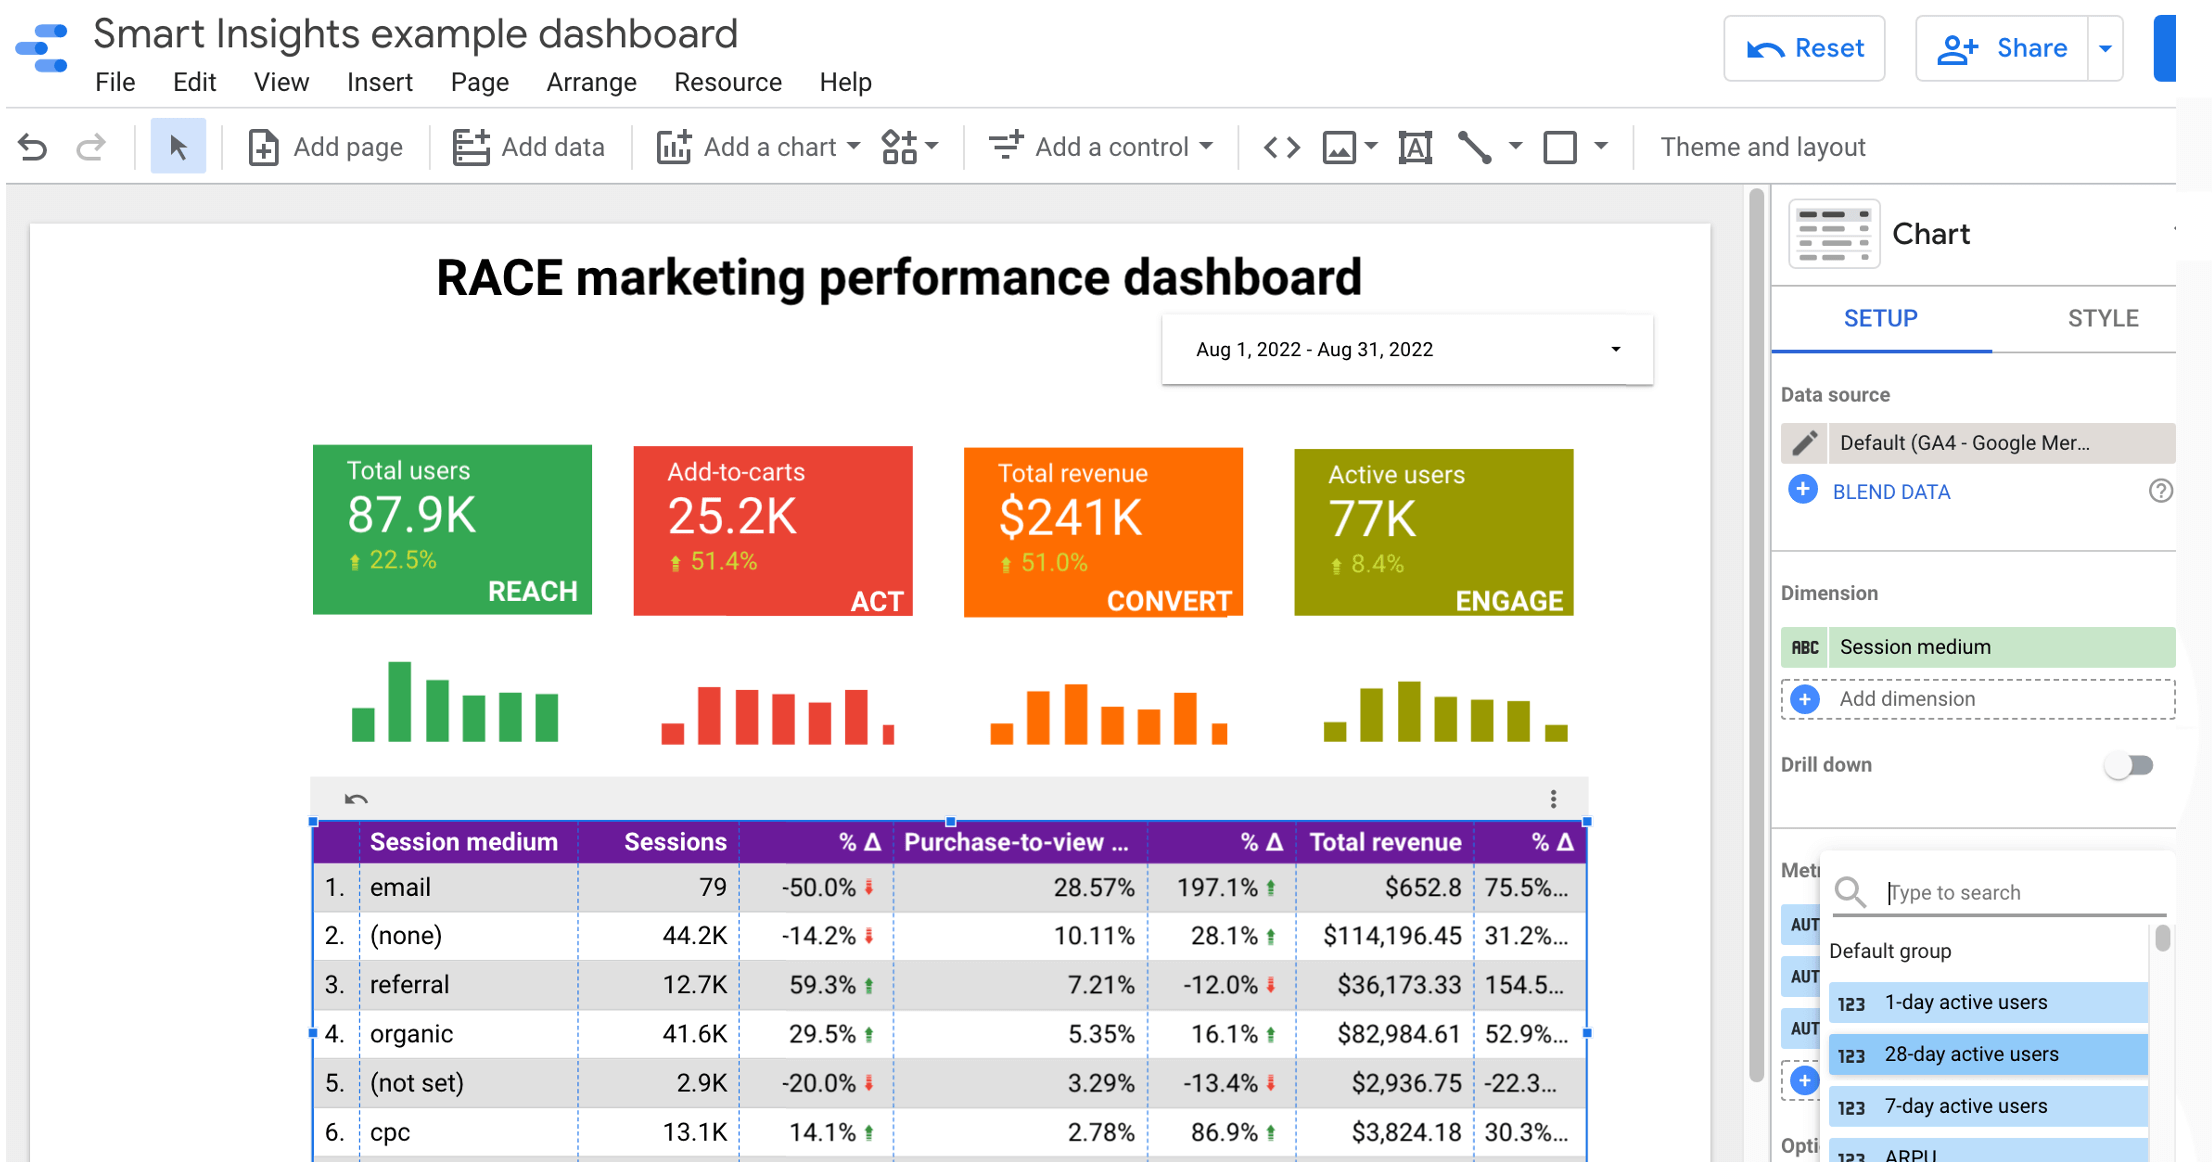
Although custom dashboards can be built in Google Analytics, it’s not readily possible to create a quality dashboard for presentation by senior management teams that summarizes the effectiveness of digital marketing across the marketing funnel for a business, particularly for the all-important ‘deltas’ of month-on-month and year-on-year performance. Using other reporting and dashboarding tools such as Looker, Domo, Dashthis, Klik and Tableau is better for this.
The purpose of the Smart Insights dashboard is to help managers to complete a regular monthly review of the current effectiveness of their digital marketing using Google Analytics 4 with Google’s Looker Studio (formerly known as Google Data Studio).
Google has recently increased quotas for Looker Studio for GA4 analysis after decreasing them as I reported at the start of the year. Details of quota increases shared here.
5. Visualize your marketing funnel
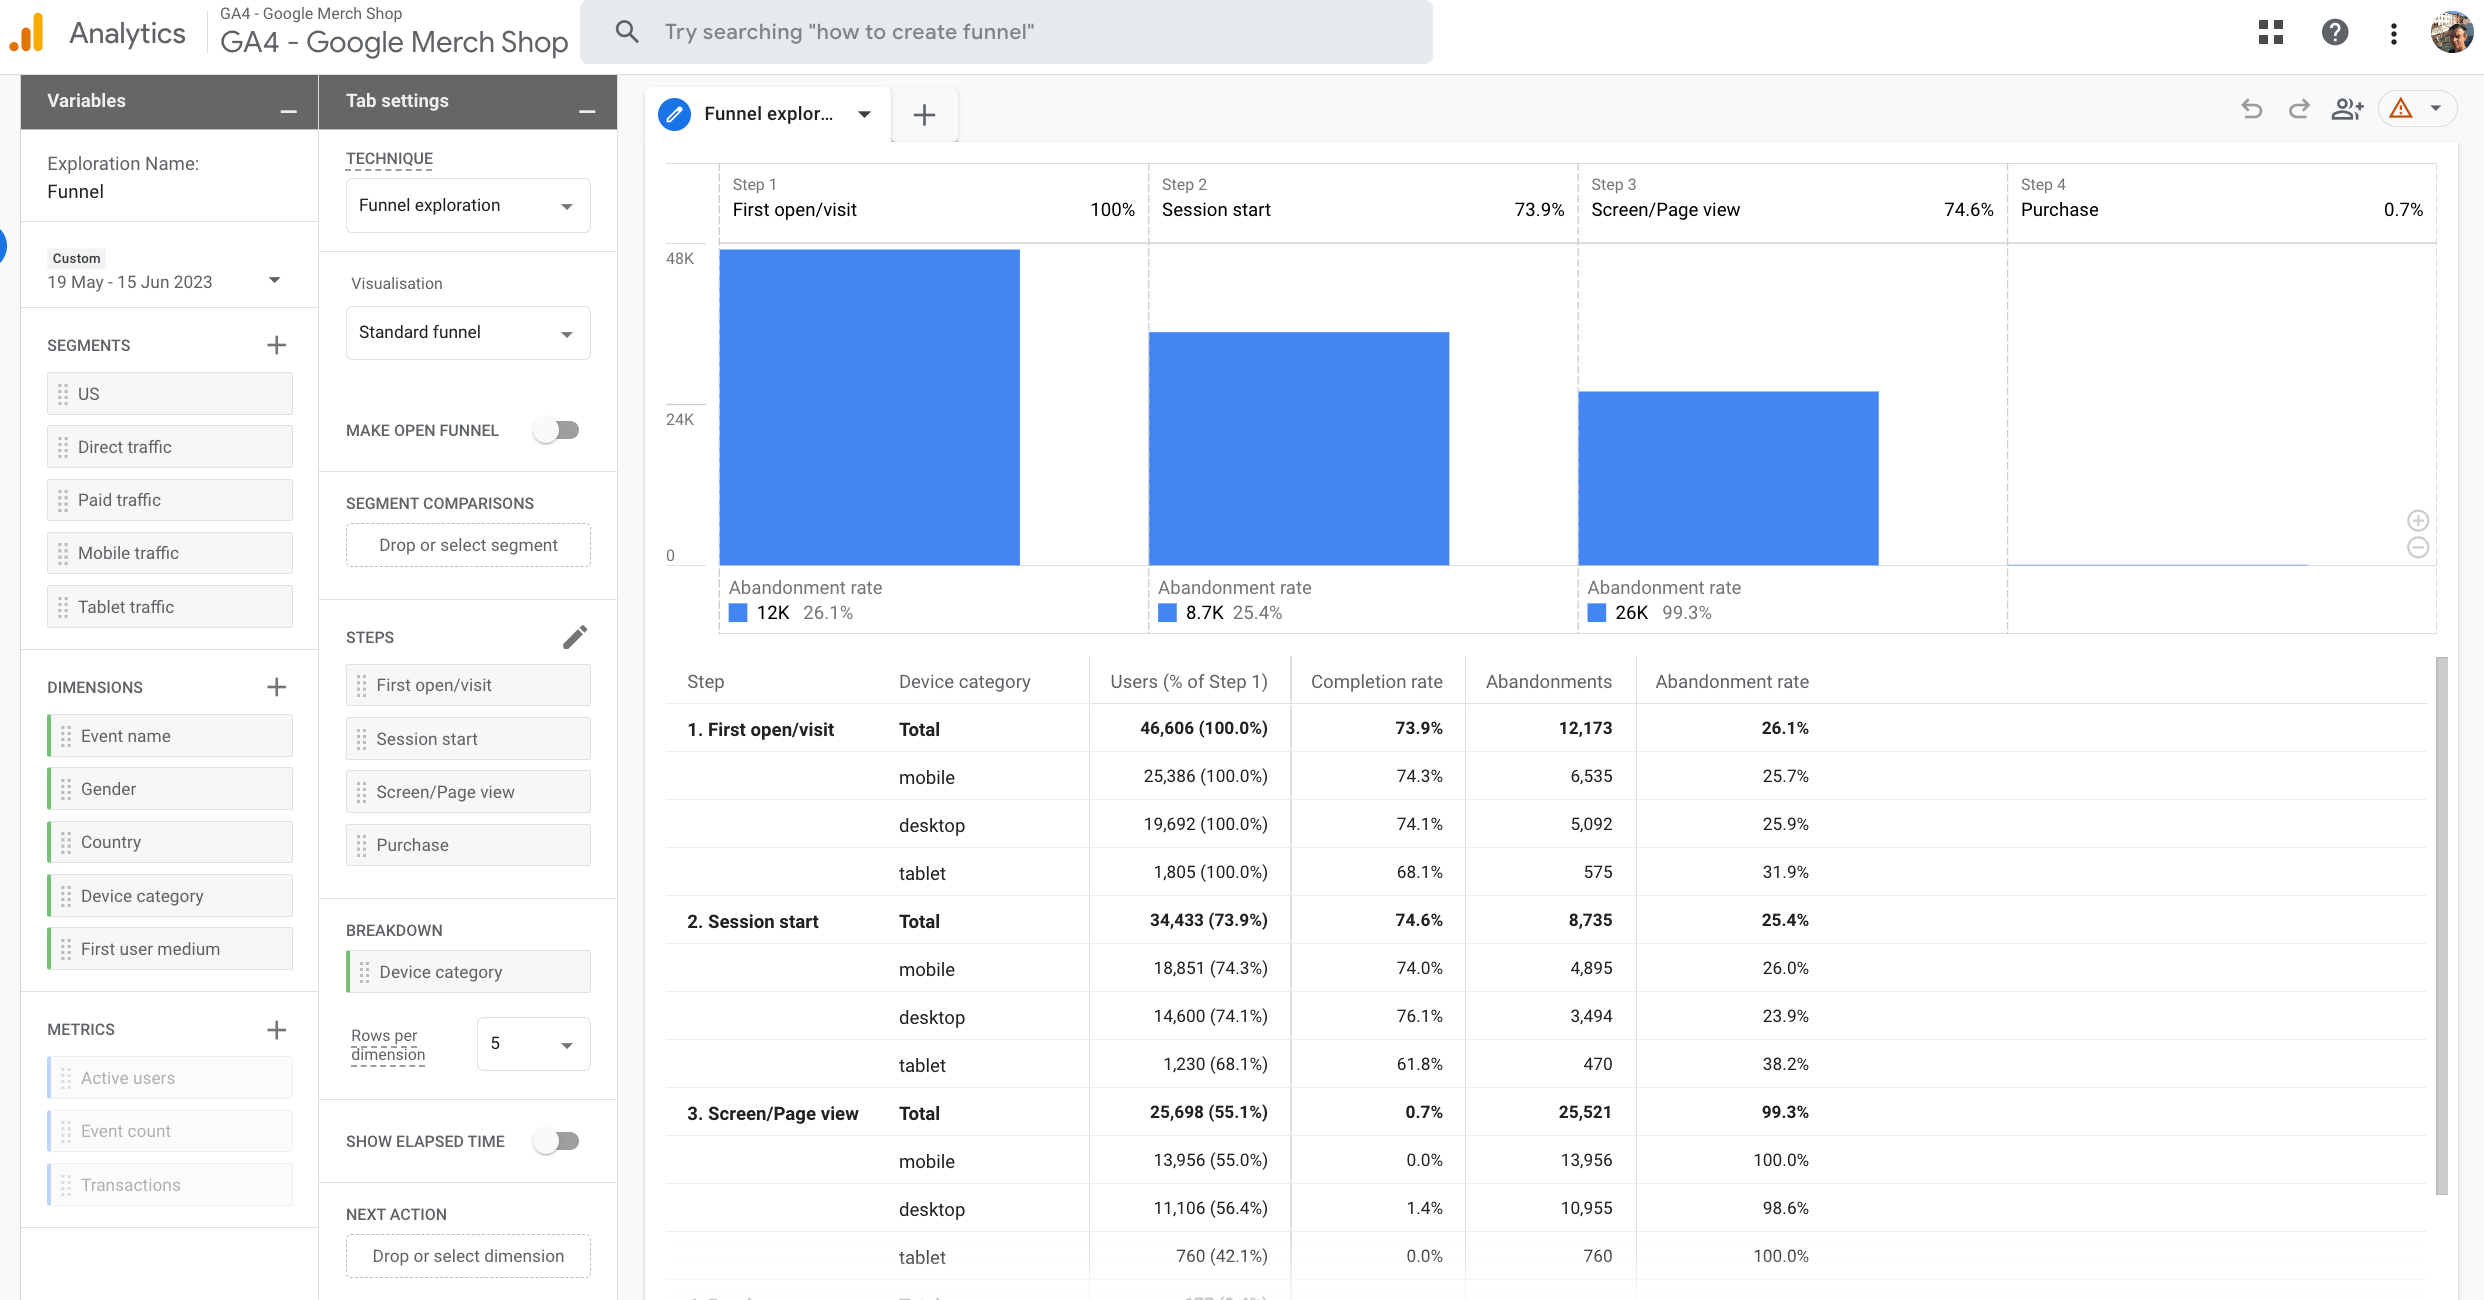
Previously, in UA, the funnel was part of goal setup. It’s an improvement in GA4 that it’s now an Exploration which means it’s more accessible and easily configurable to other types of non-e-commerce business.
This example Exploration shows how you can segment your funnel to compare dimensions for different audiences. In this case, it’s different types of device and you can see that mobile devices have lower conversion than expected.
Although funnels are visually appealing because of their simplicity, the reality is that they don’t vary much between reviews, so for a more detailed understanding of paths there are improved Path exploration reports in GA4. We’d also recommend regularly reviewing the top 3 reports as shown in the next sections.
In the guide, the final steps we cover are:
6. Define your process for reviewing and improving funnel efficiency
7. Learn how to analyze using standard reports
8. Learn how to setup and share custom reports and Explorations
9. Exploit platform integrations
10. Track and adopt the latest features
I hope you’ve found the tutorial in the guide useful to support your use of GA4 for marketing. Do feedback or ask me any questions via LinkedIn.
Strengthen your strategy with RACE-powered templates, frameworks and planning tools designed to help you review performance, identify improvements and build a more effective marketing approach.