Managing all the data associated with SEO can be difficult, but Google Sheets can make it more manageable to handle and compare your data.
Managing SEO tasks requires you ti handle a lot of data. While most SEO tools obviously include their own analytics packages, it’s often awkward to gain a clear picture of your overall situation while jumping between these platforms. Enter Google Sheets.
If you didn’t know, Sheets is Google’s free cloud-based alternative to Excel. On top of easy collaboration, its main benefit for SEO professionals is direct integration with Google’s other tools. Chief among these are Keyword Planner and Search Console.
In this article, we’ll look at a number of ways you can leverage Google Sheets to manage your SEO tasks. This will include tricks to save time coordinating projects, as well as concrete ways you can find and leverage data to improve your search engine rankings and increase traffic.
First, let’s look at how to get started.
1. Accessing SEO data in Google Sheets
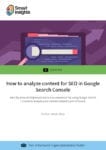
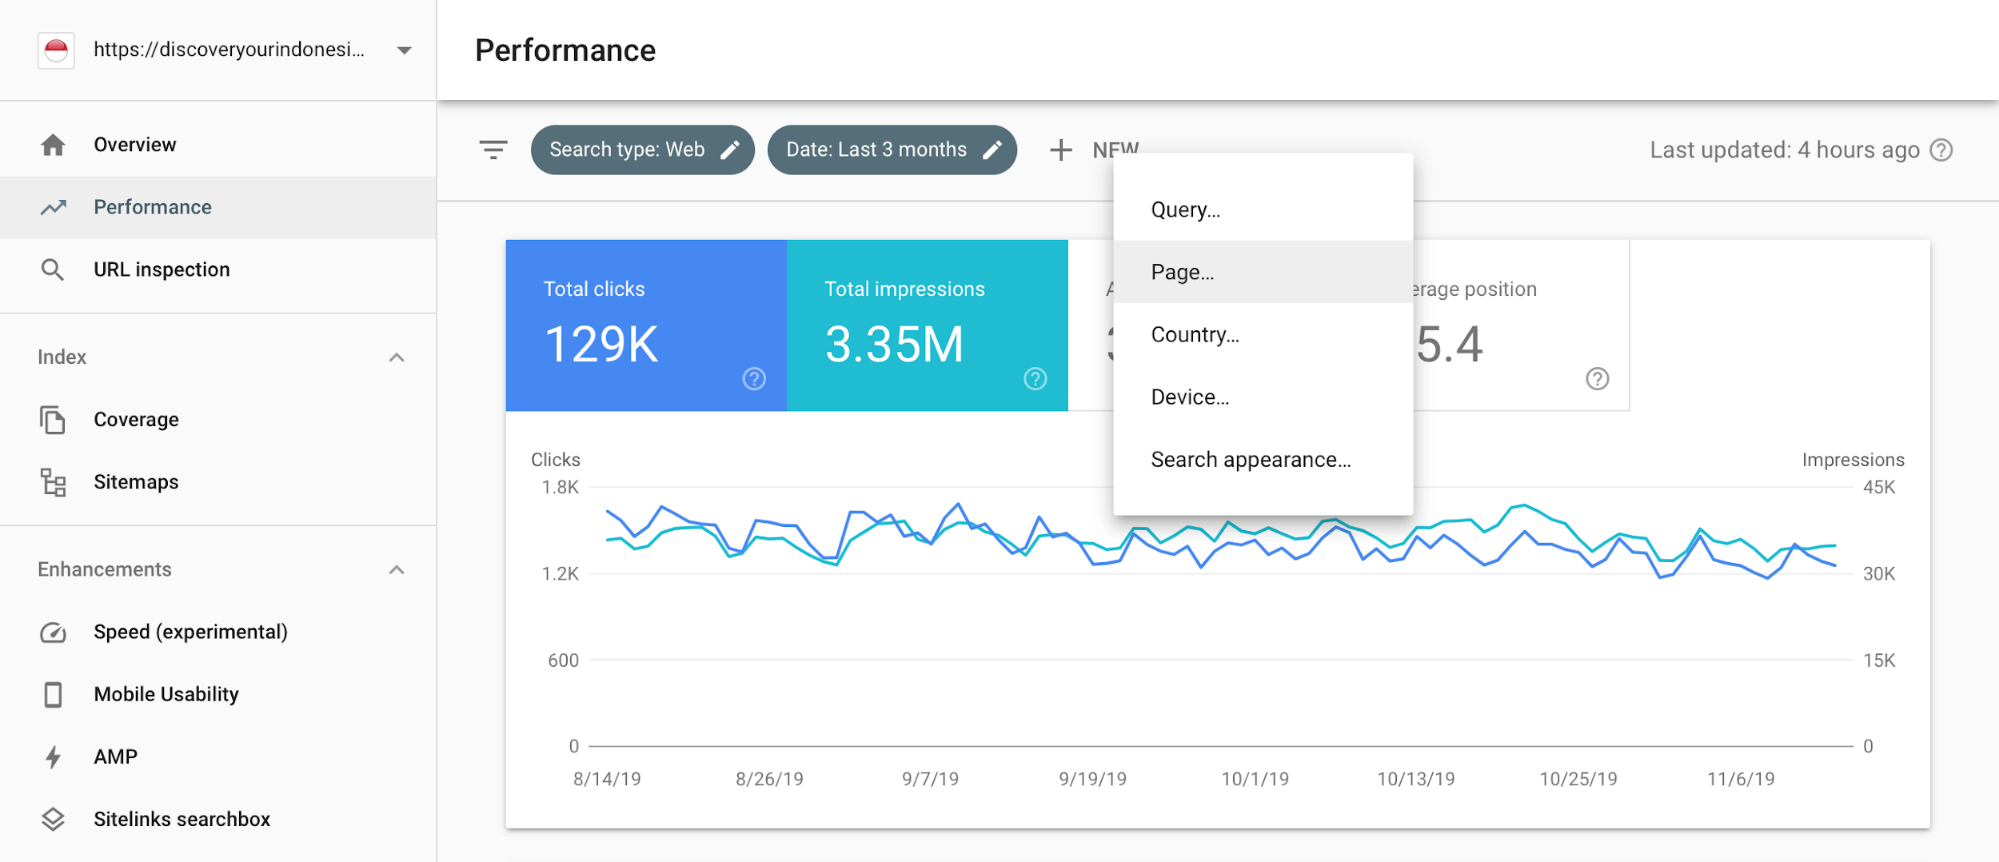
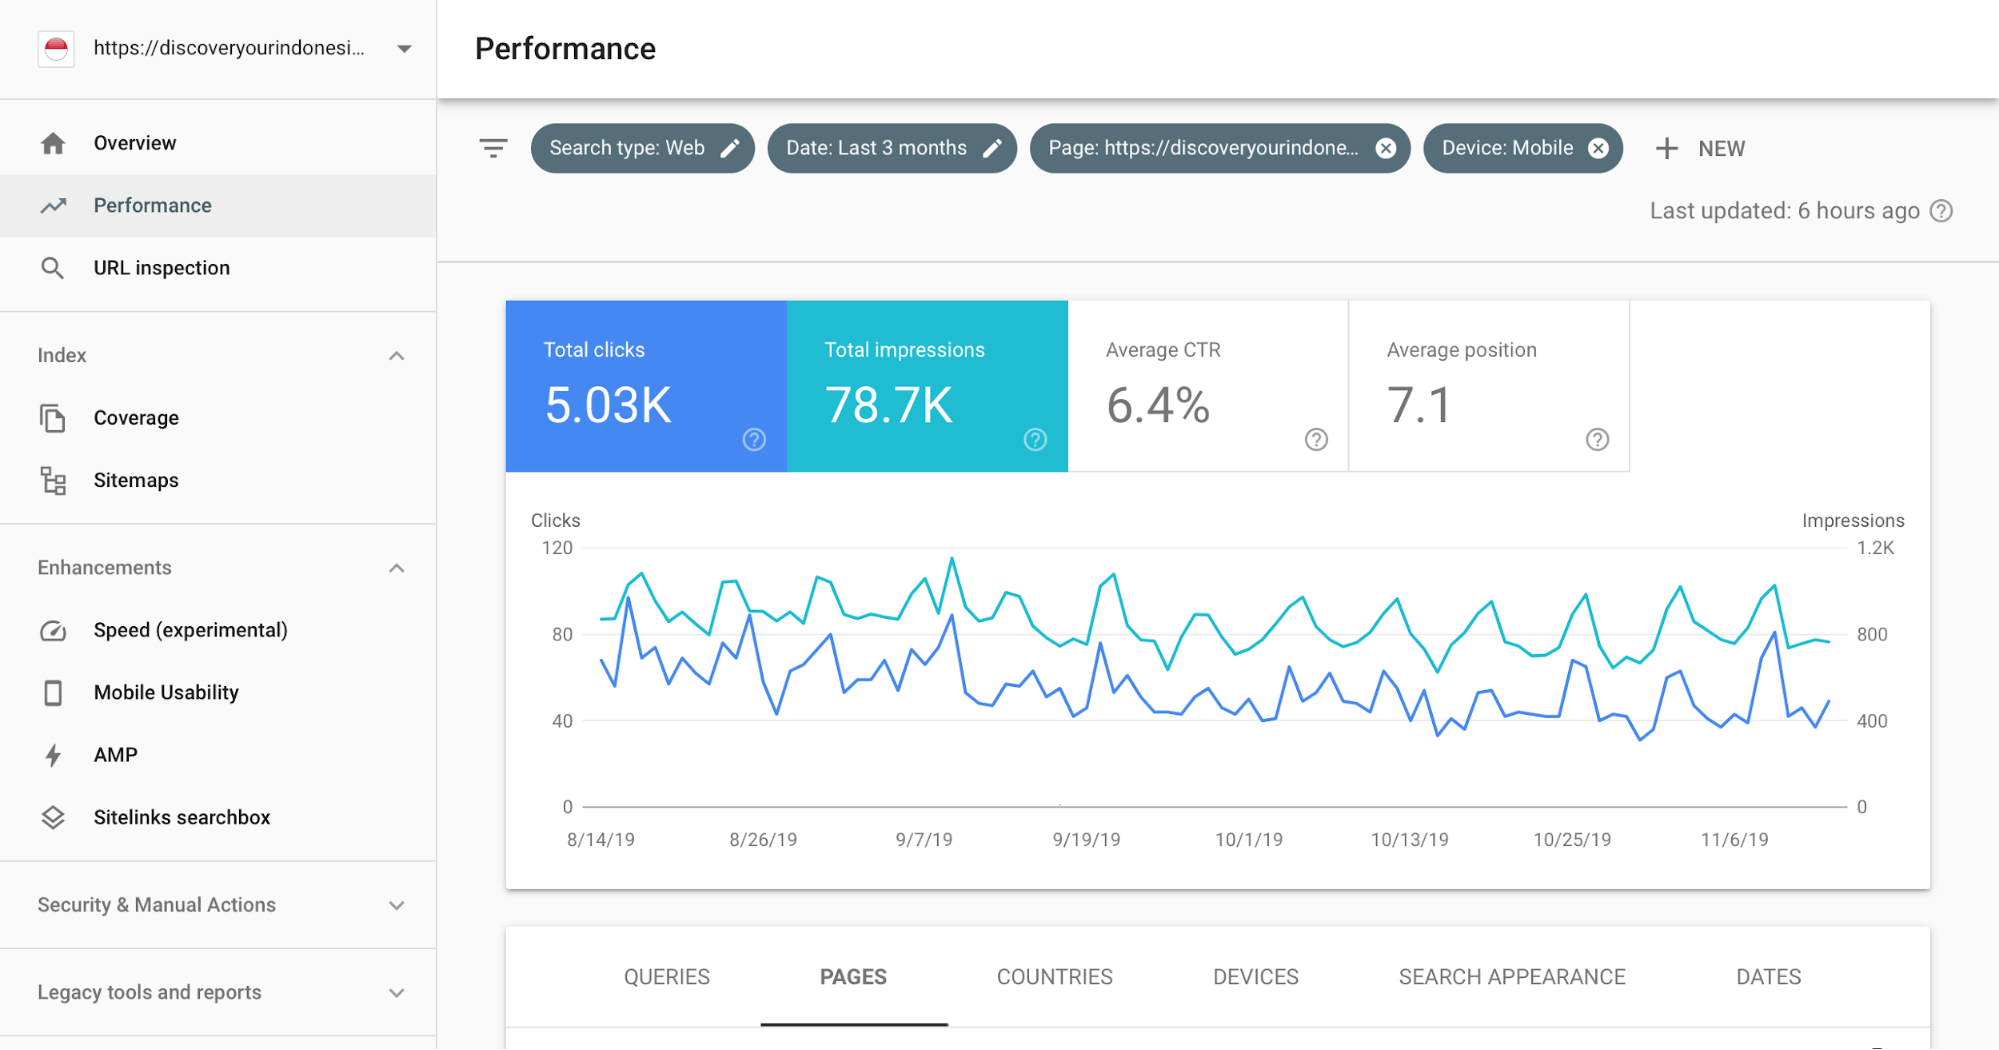
To start with, open Search Console and head over to the ‘Performance’ page under ‘Overview’. Here you’ll see a graphic overview of your site’s overall performance, including clicks, impressions, CTR and average position.
However, we’re more interested in the fine details of how your site is performing. Scroll down and you’ll find a table. This helps you review the same metric, but with the following filters:
- Search query - every search term you rank for.
- Page - the individual pages on your site.
- Country - the locations where searches occur.
- Device - the devices used to access your site.
- Search appearance - visual elements like accelerated mobile performance or rich snippets.
- Date - when the search occurred.
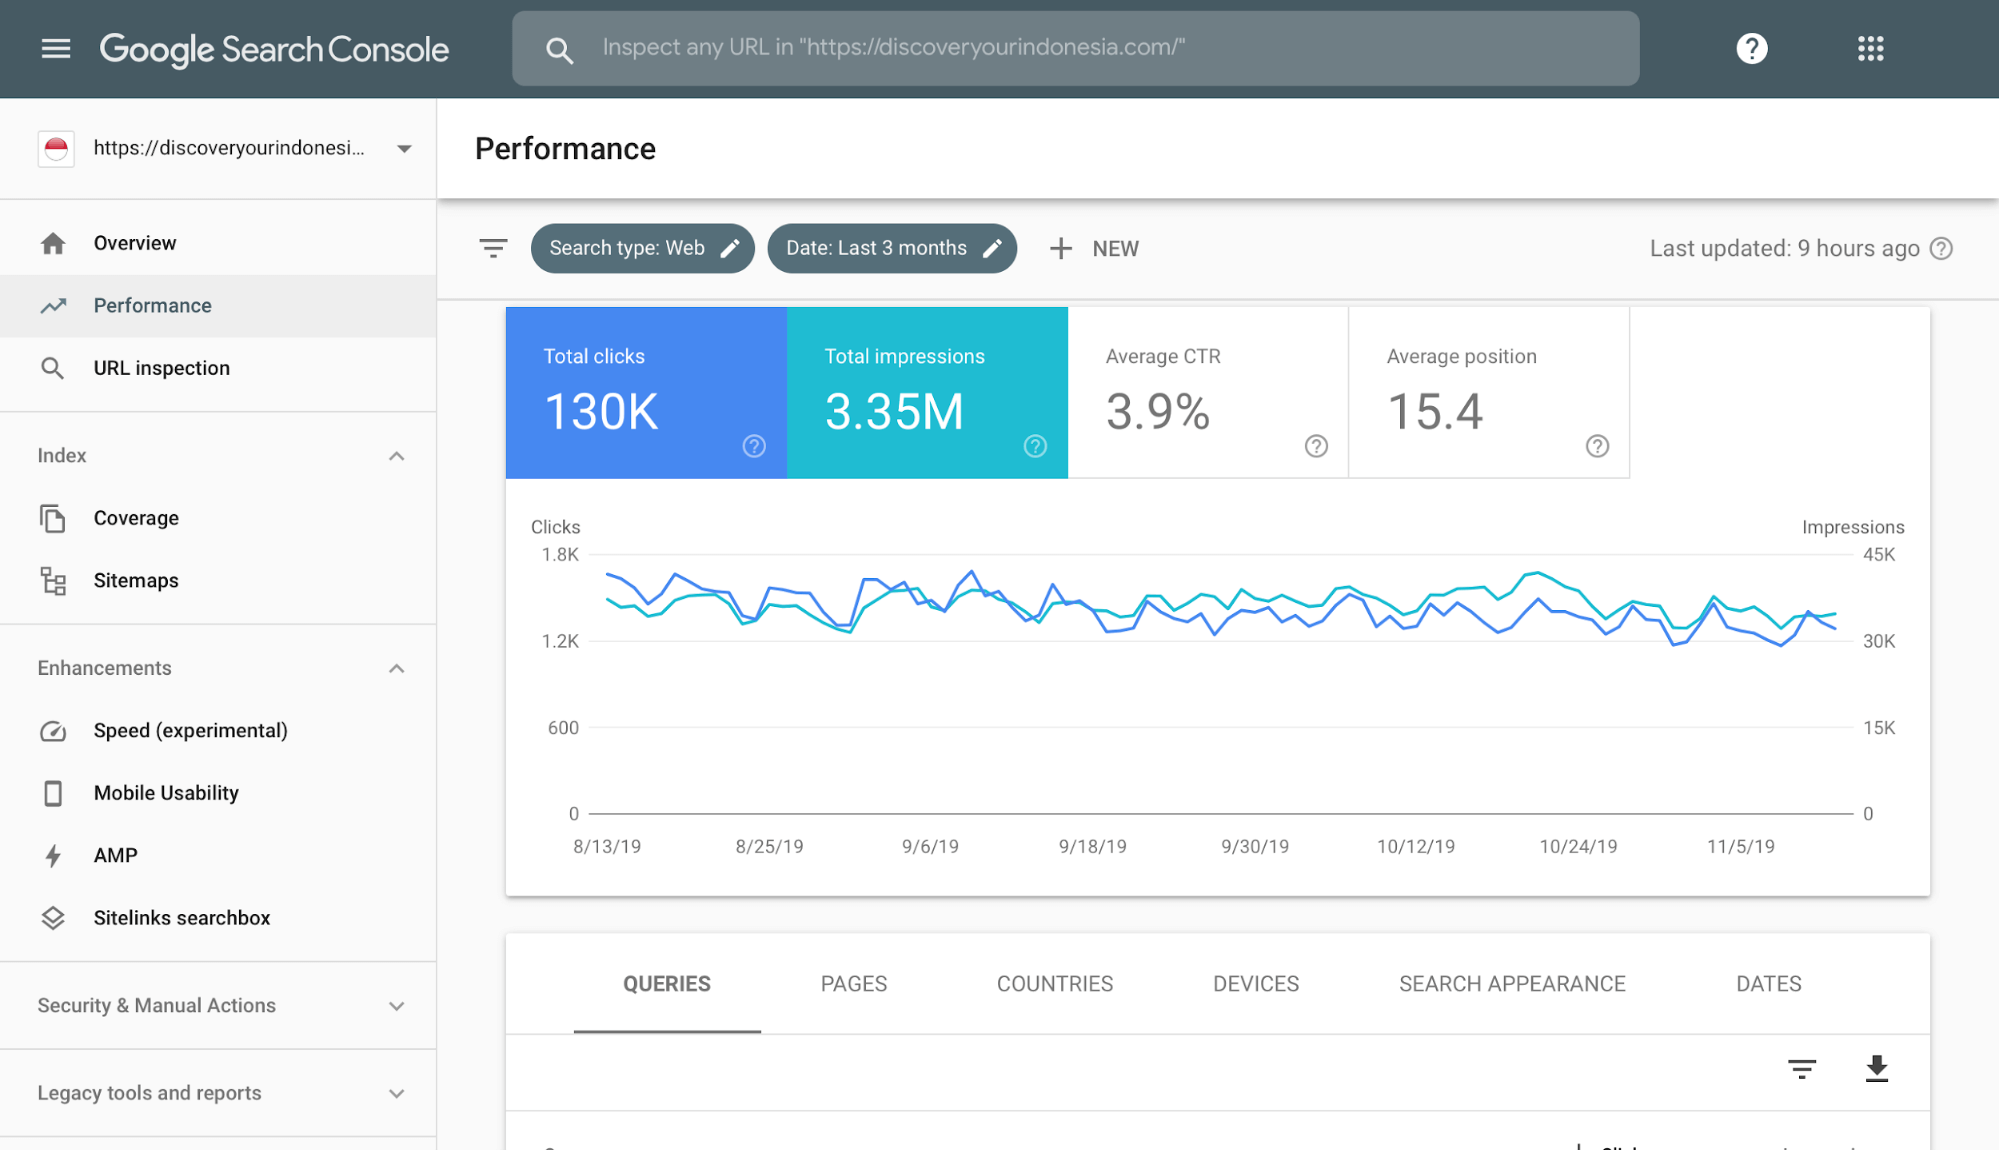
These six tabs are where we’re going to get our data. We’ll then export it to a Google Sheet. For now, let’s go with the data under ‘pages’.
To access this, simply select the ‘pages’ tab. On the right-hand side, you’ll see a downward-facing arrow. Clicking this will give you the option to export to Google Sheets.
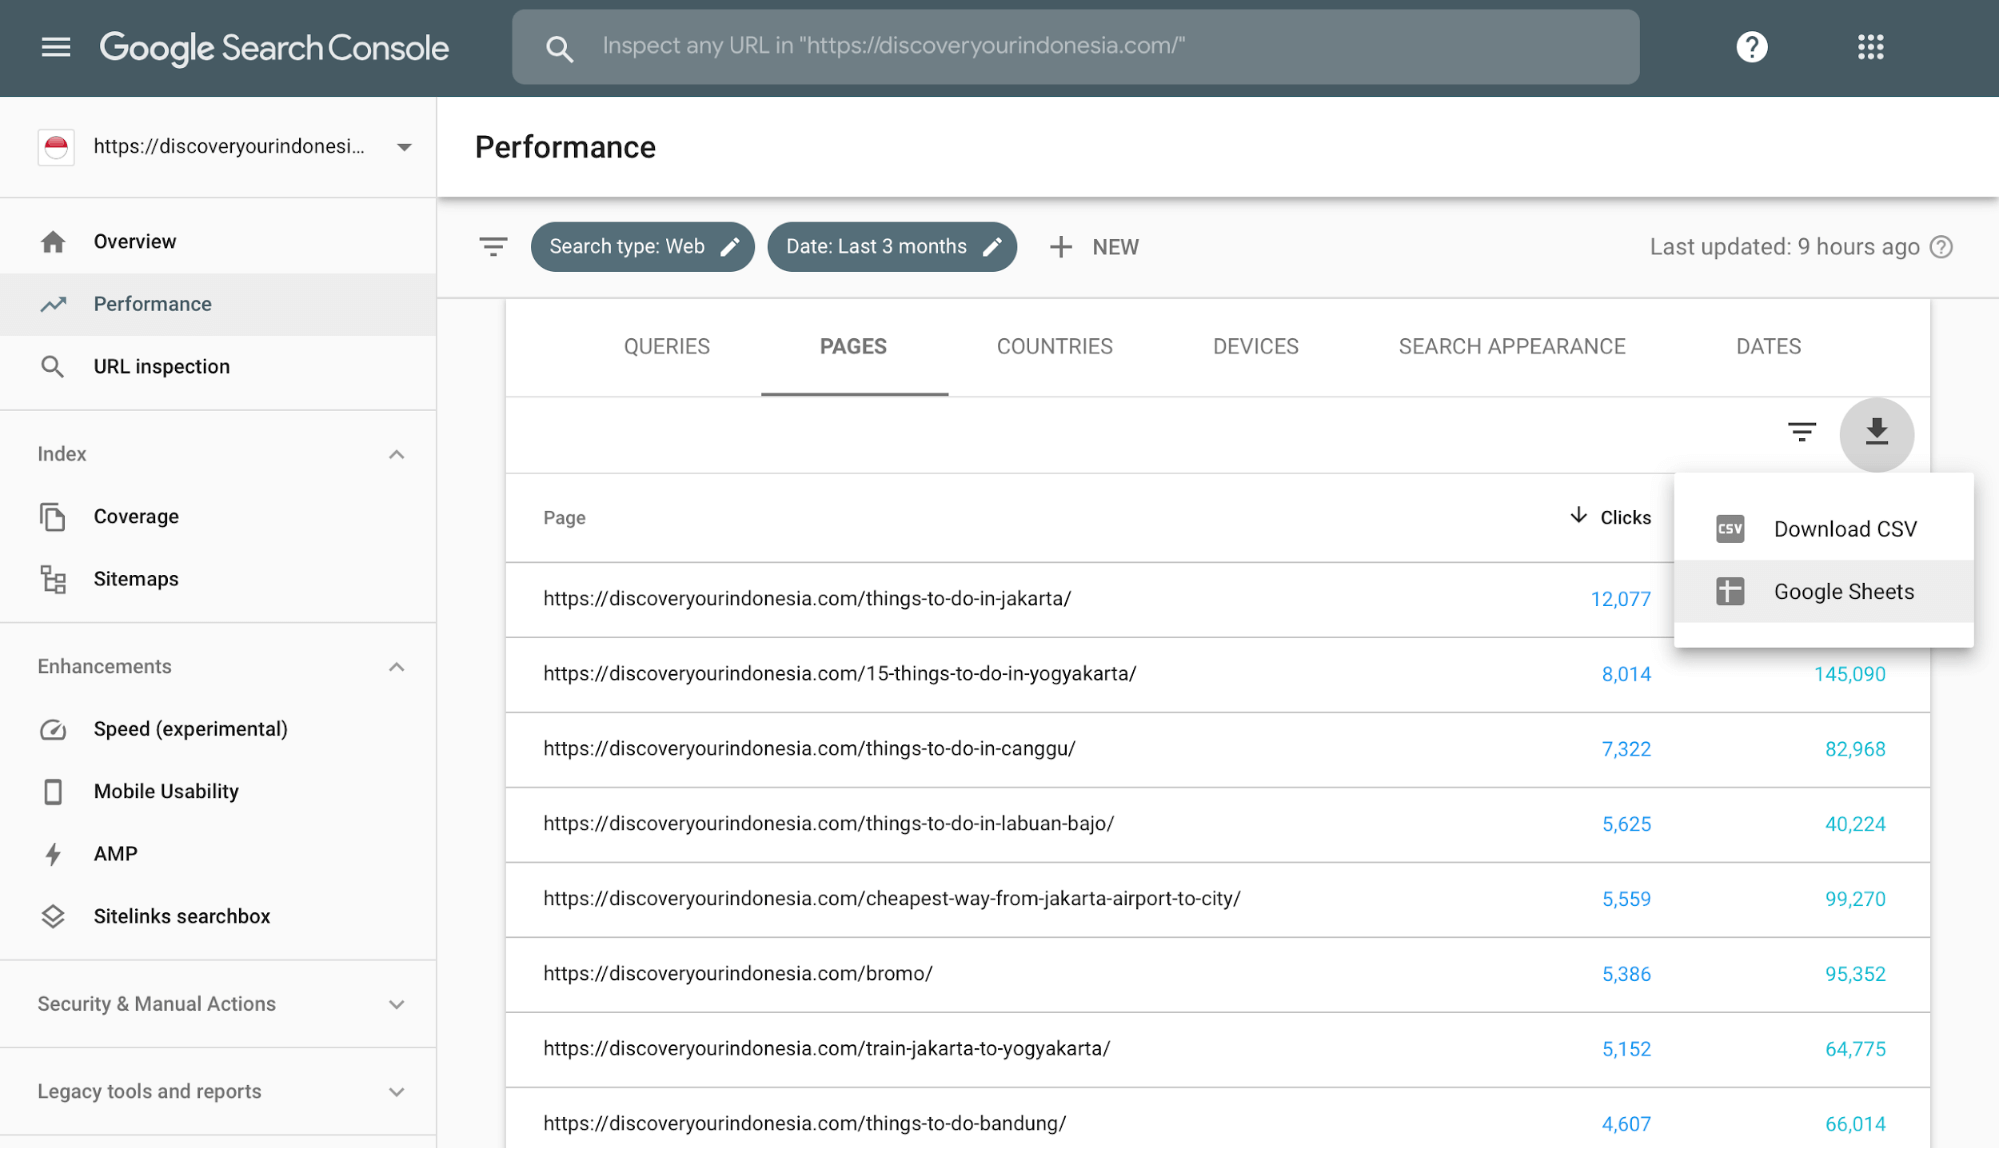
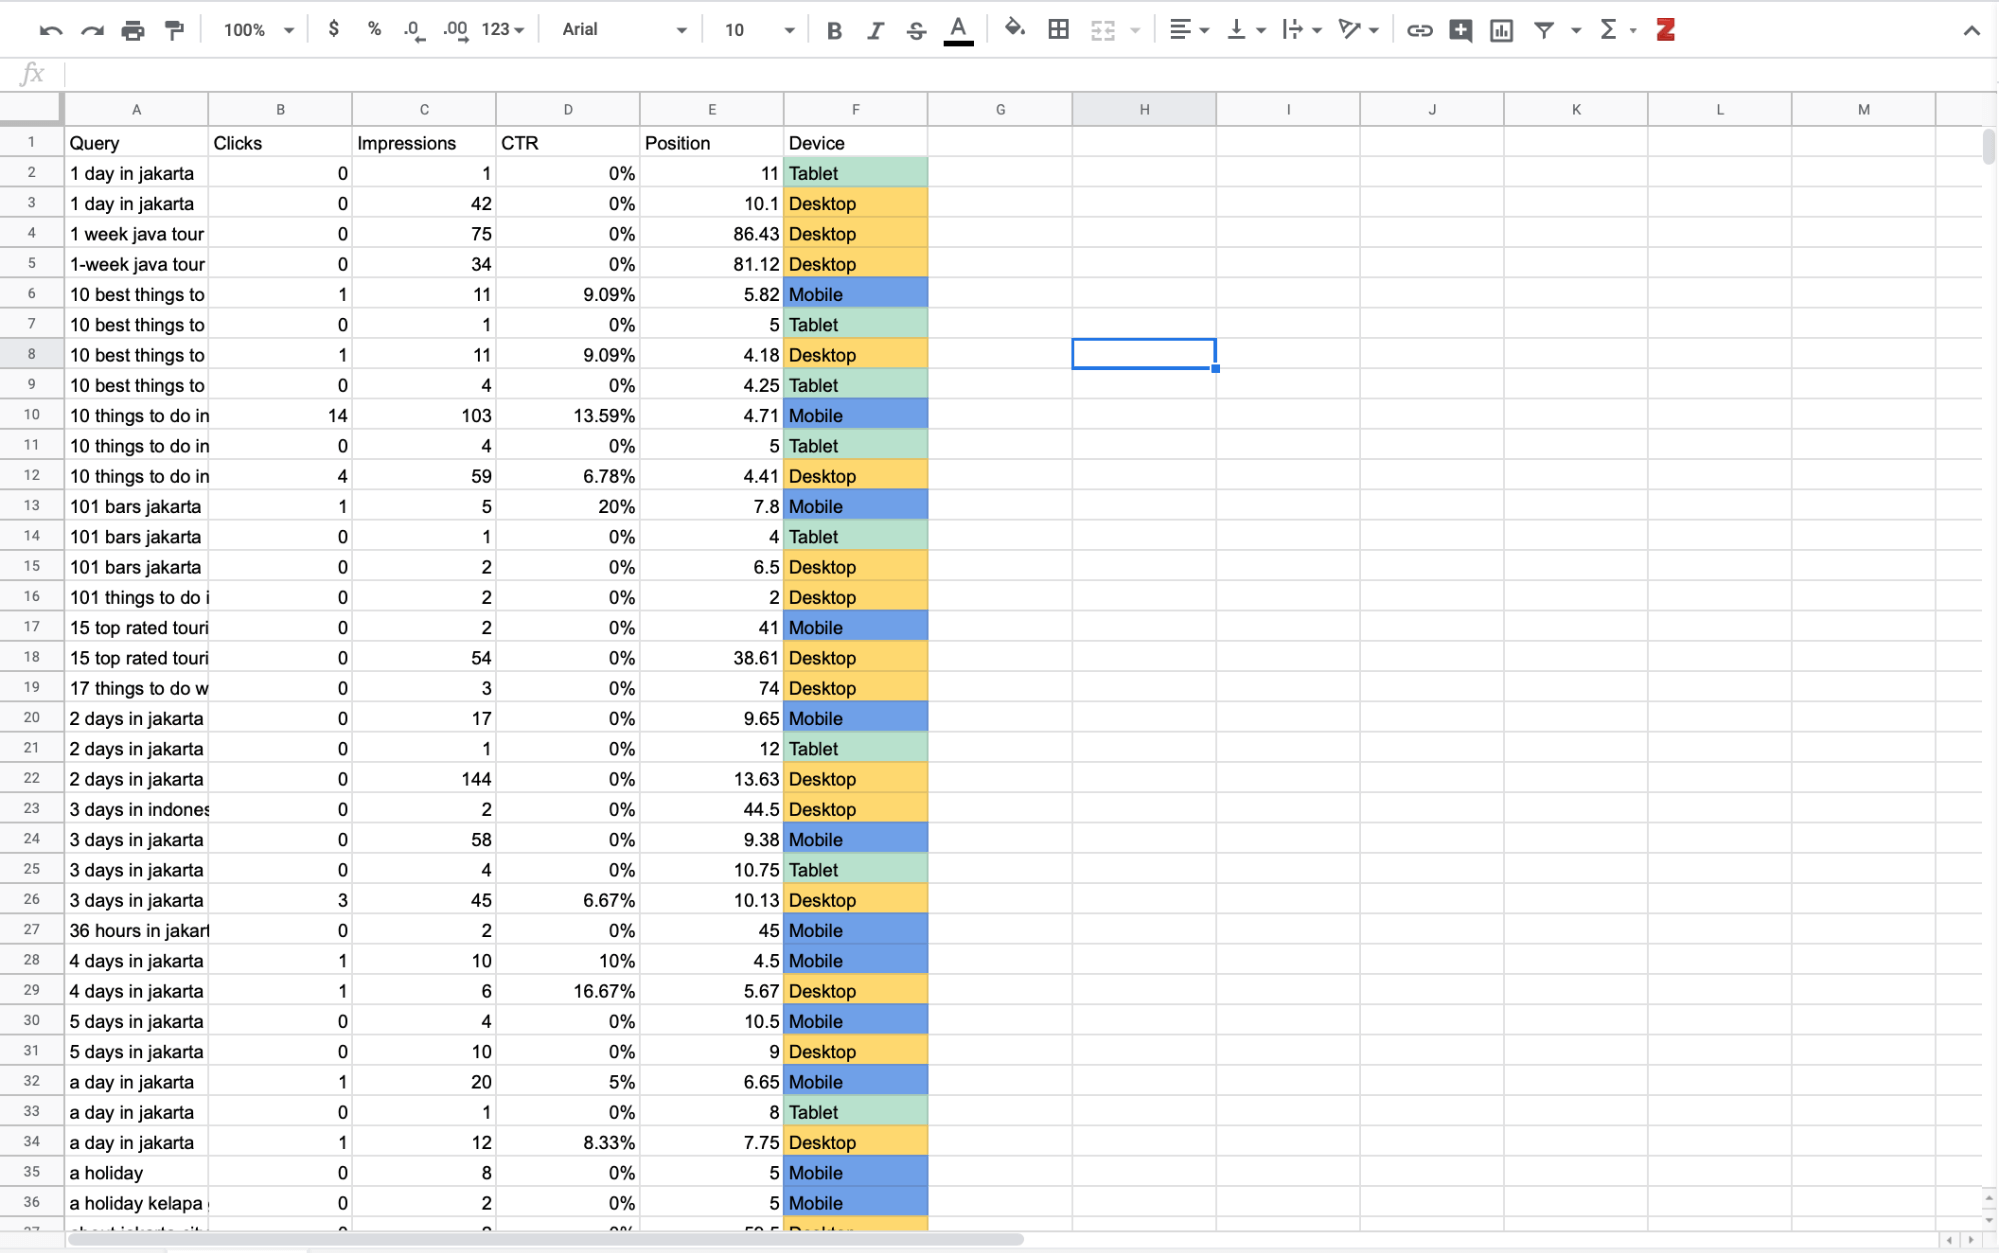
Hey presto, a Google Sheet automatically opens in a new tab. This displays the individual clicks, impressions, CTR, and position for every page on your site.
This exact same process applies to all of the tabs on the Performance page in Search Console. Now we’re ready to start manipulating this data to manage SEO tasks.
2. Improve on-page SEO
Let’s look at how you can use Google Sheets to improve your on-page SEO. Your first step is to sort all of the pages on your site by Impressions. This way, you can identify your 20 best-performing pages.
Back in Keyword Planner, we’re going to create a ‘Page’ filter for each page individually.
Now scroll back down to the table, select Queries, and export this data to Google Sheets using the same method as before. Now you have the data for the Search Queries that lead to your most popular pages.
Rinse and repeat for your remaining 19 best performers. Your spreadsheet now has 21 tabs.
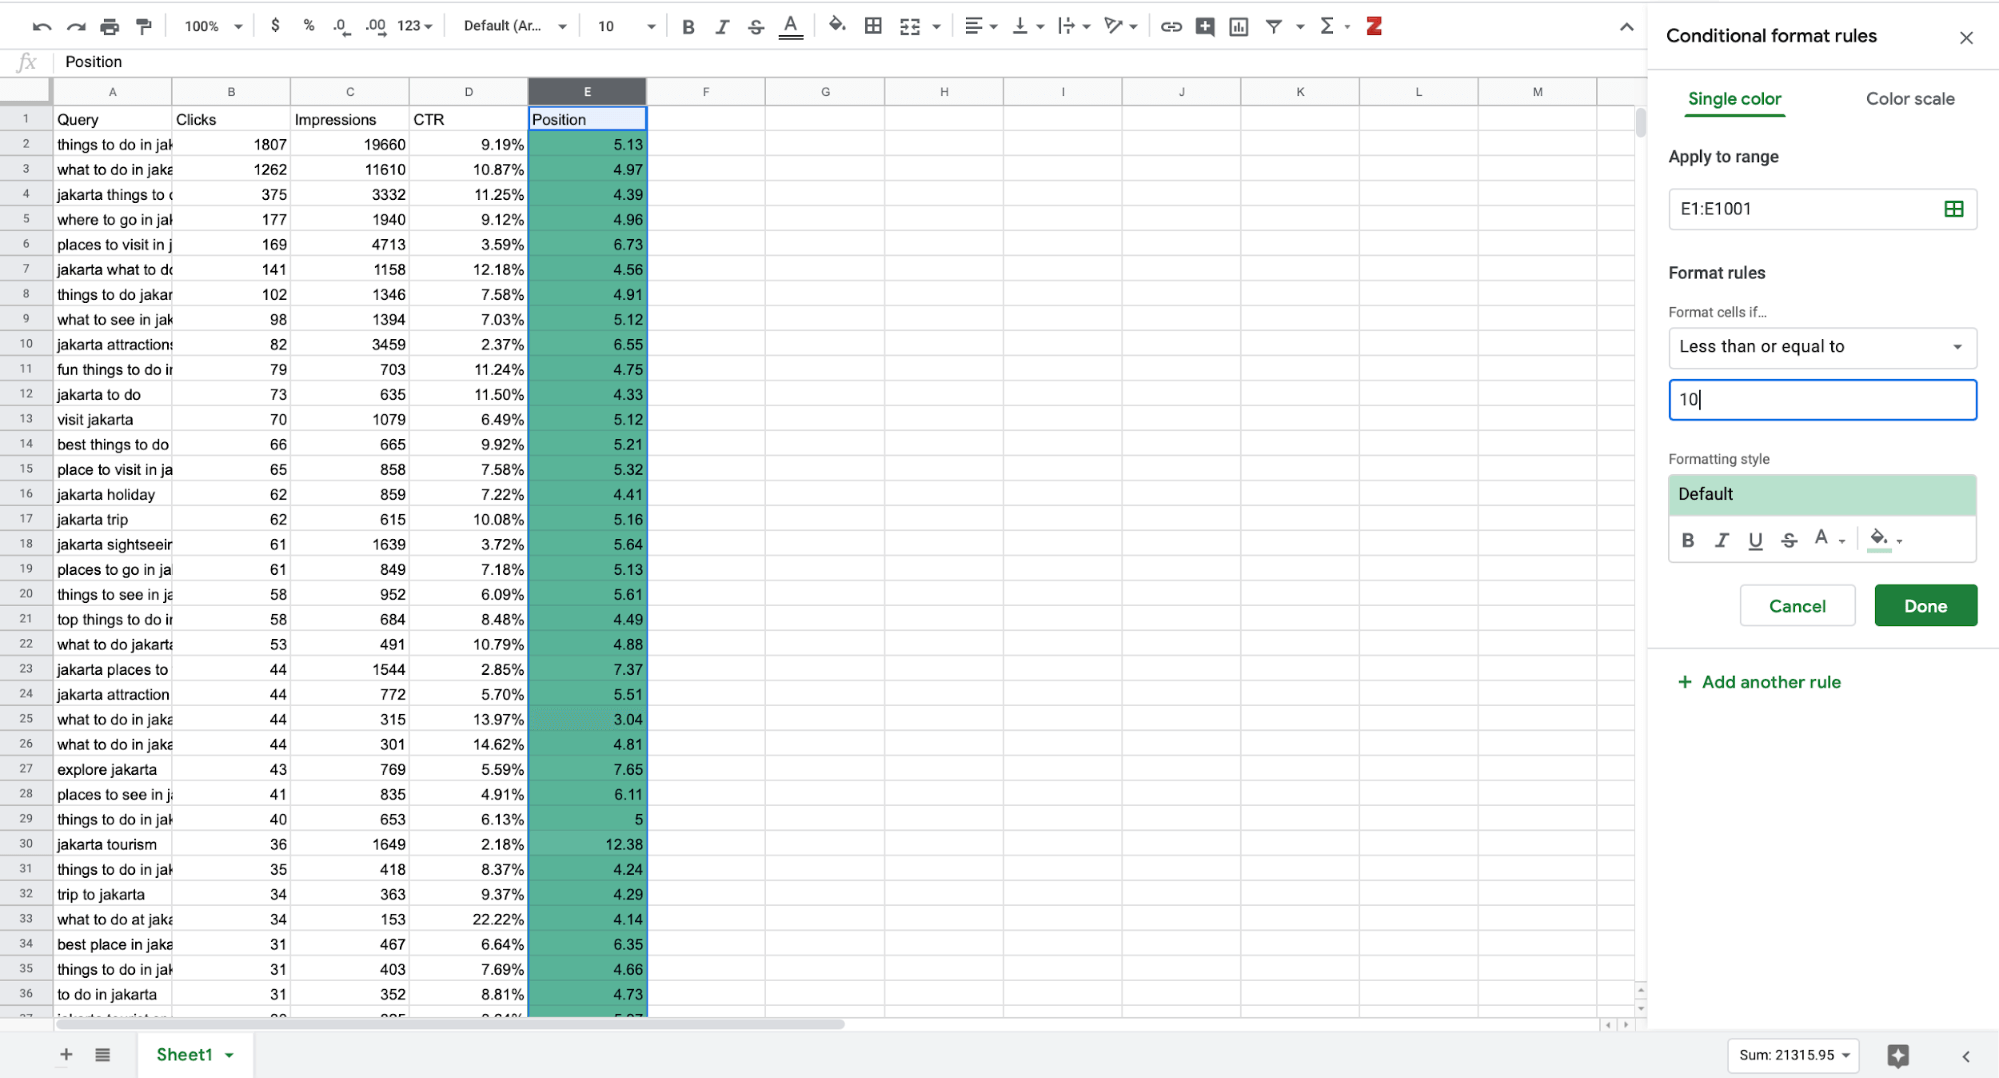
Next, for each page we’ll apply some conditional formatting to the Position column, using a traffic light approach. You can find ‘conditional formatting’ under the ‘Format’ tab.
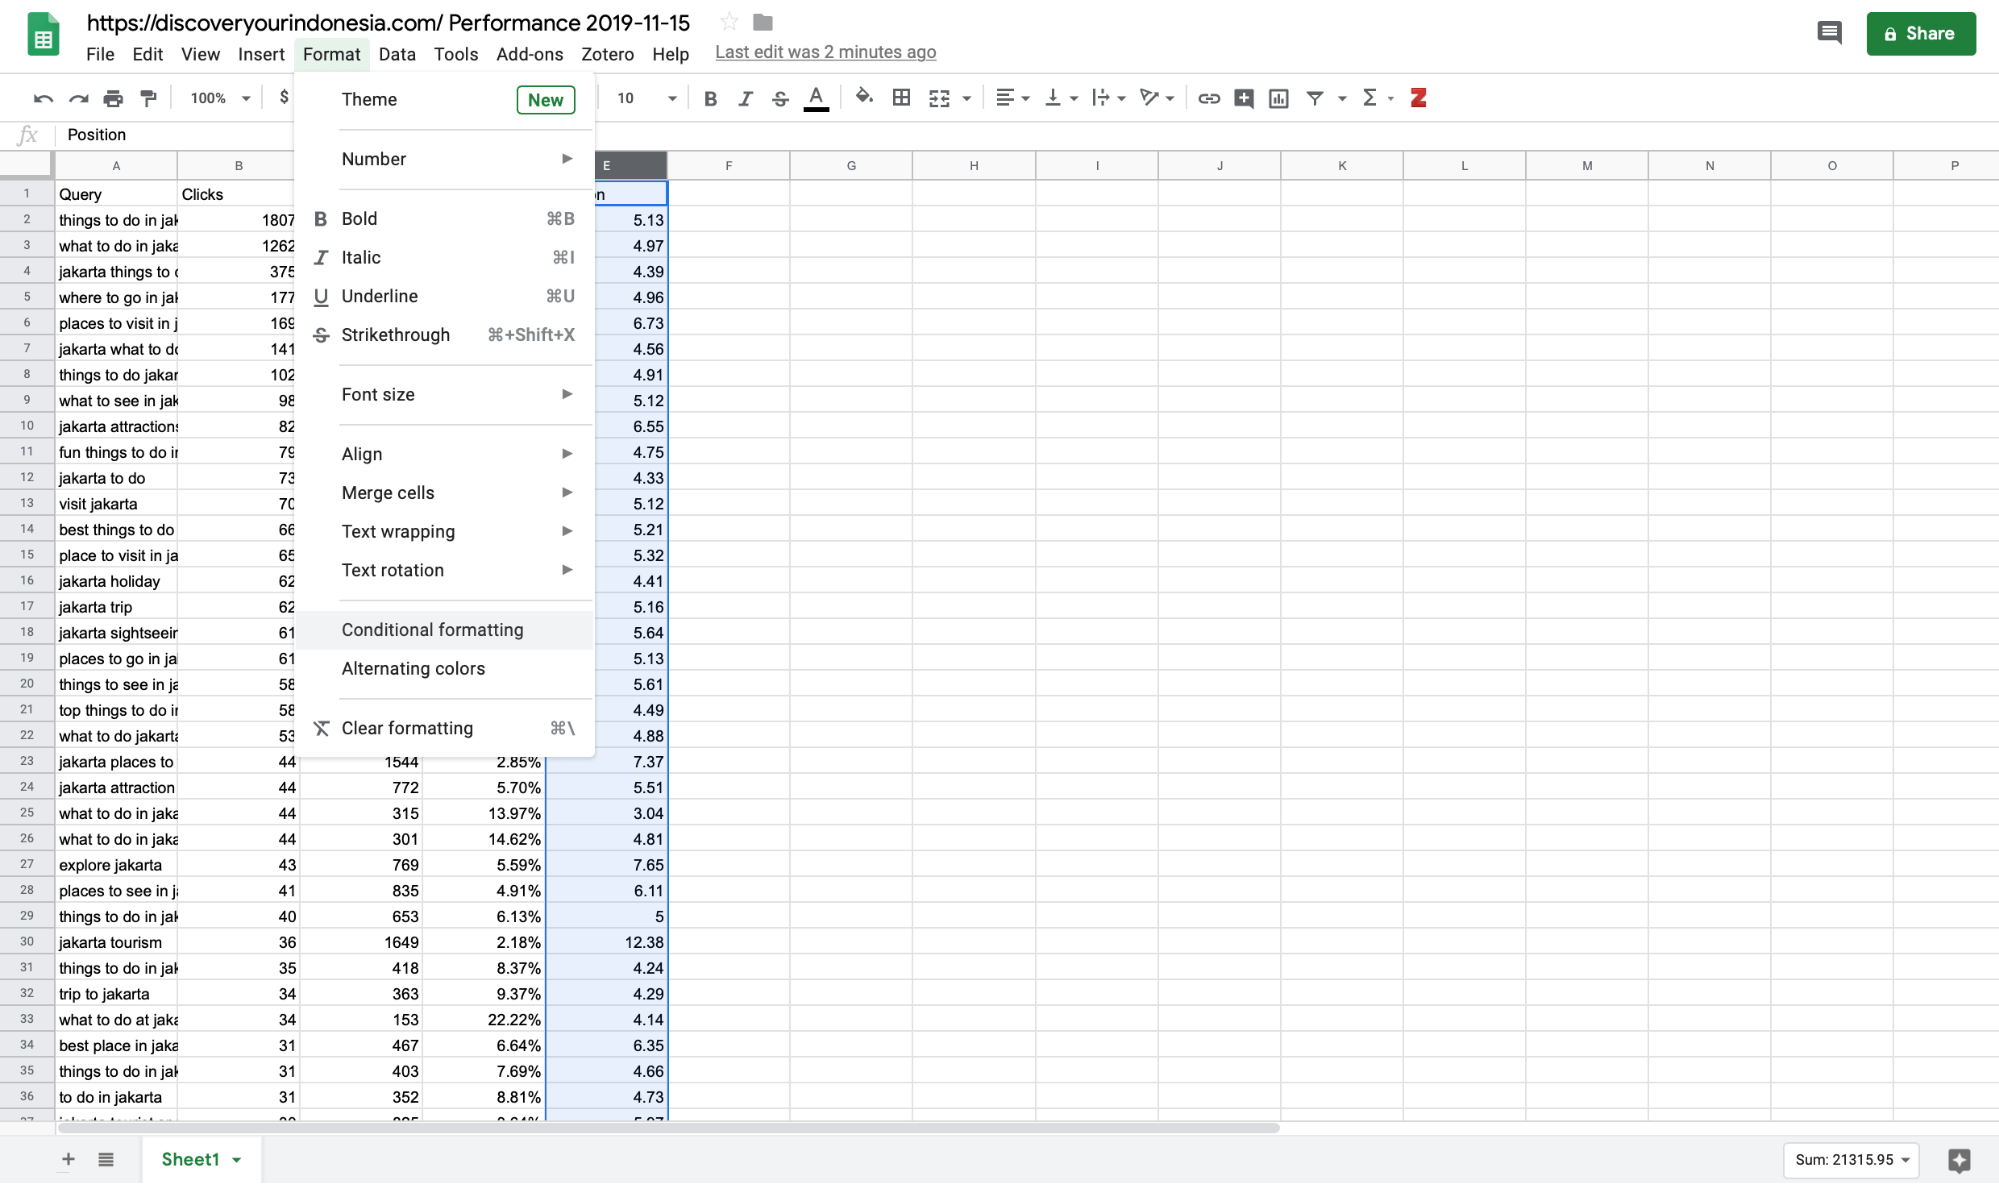
We’ll highlight any value of ten or below in green, ten to 21 in orange, and 21+ in red.
This gives you an easy way to prioritize which Search Terms to optimize. Here’s a couple of actions you can take depending on what you find:
- If a ‘green’ term has a low CTR, you can improve your metadata to attract more clicks.
- If a ‘red’ term has a lot of impressions but a low CTR, you can raise your keyword density to improve your ranking for that term.
- For ‘orange’ keywords, you’ll need to improve keyword density. However, building links to your content is the action that will really move the needle.

3. Compare performance over time
Any time you make a change to your site, you, of course, want to measure its impact. For example, if you take any of the actions in the last section, you’ll want to know they actually worked.
Search Console will allow you to compare two different time periods, but you can go a little further in Google Sheets. Specifically, we’ll identify which queries improved or declined after being updated.
Select the Date filter in Search Console, then select Compare. For the sake of demonstration, let’s compare the last three months to the three months before that.
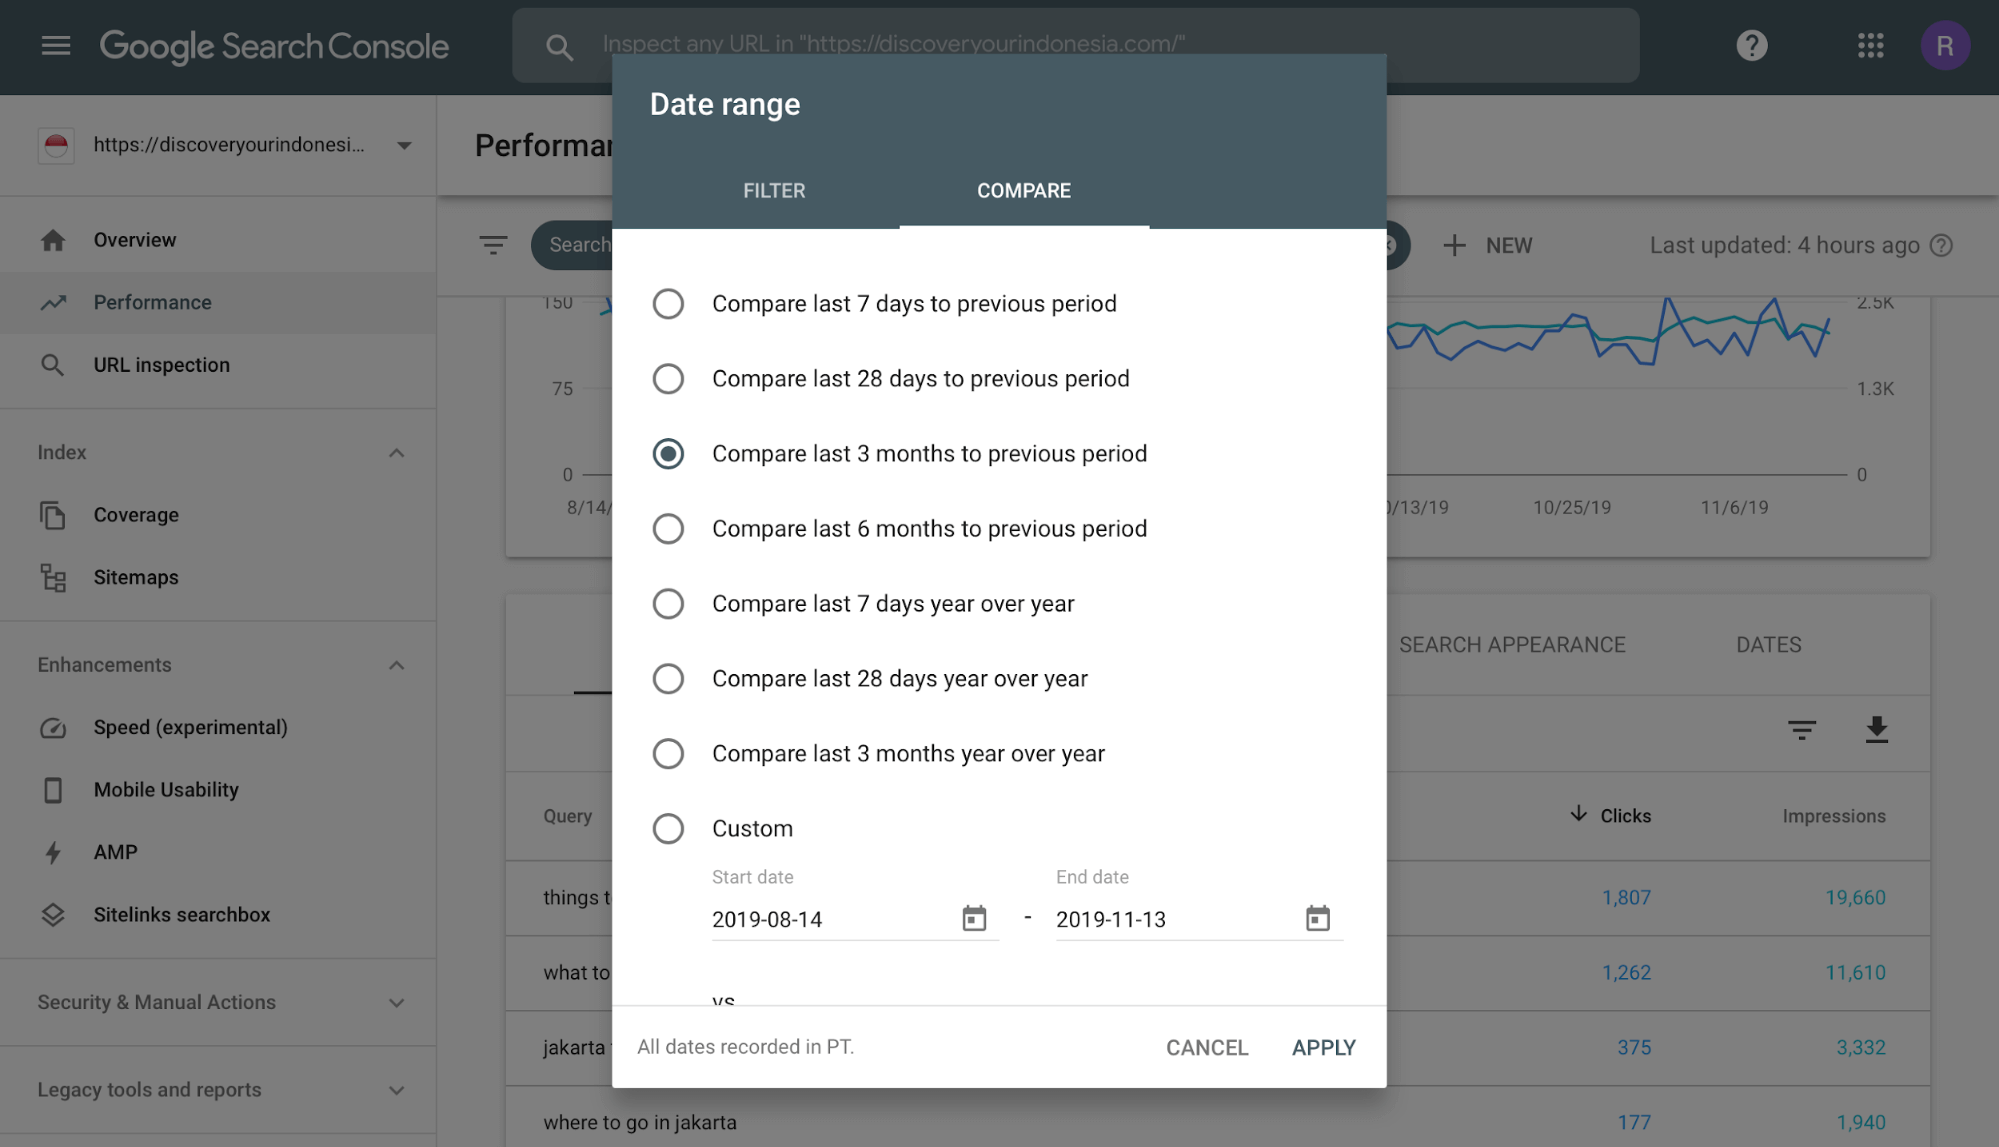
Again, head down to the Queries tab and export your data to Google Sheets. For now, we’ll do this for the entire site, but if you want to look at individual pages, you can do this with a Page filter.
You’ll be met with something like this, showing the Clicks, CTR, Impressions, and Position for each Query in each three month period.
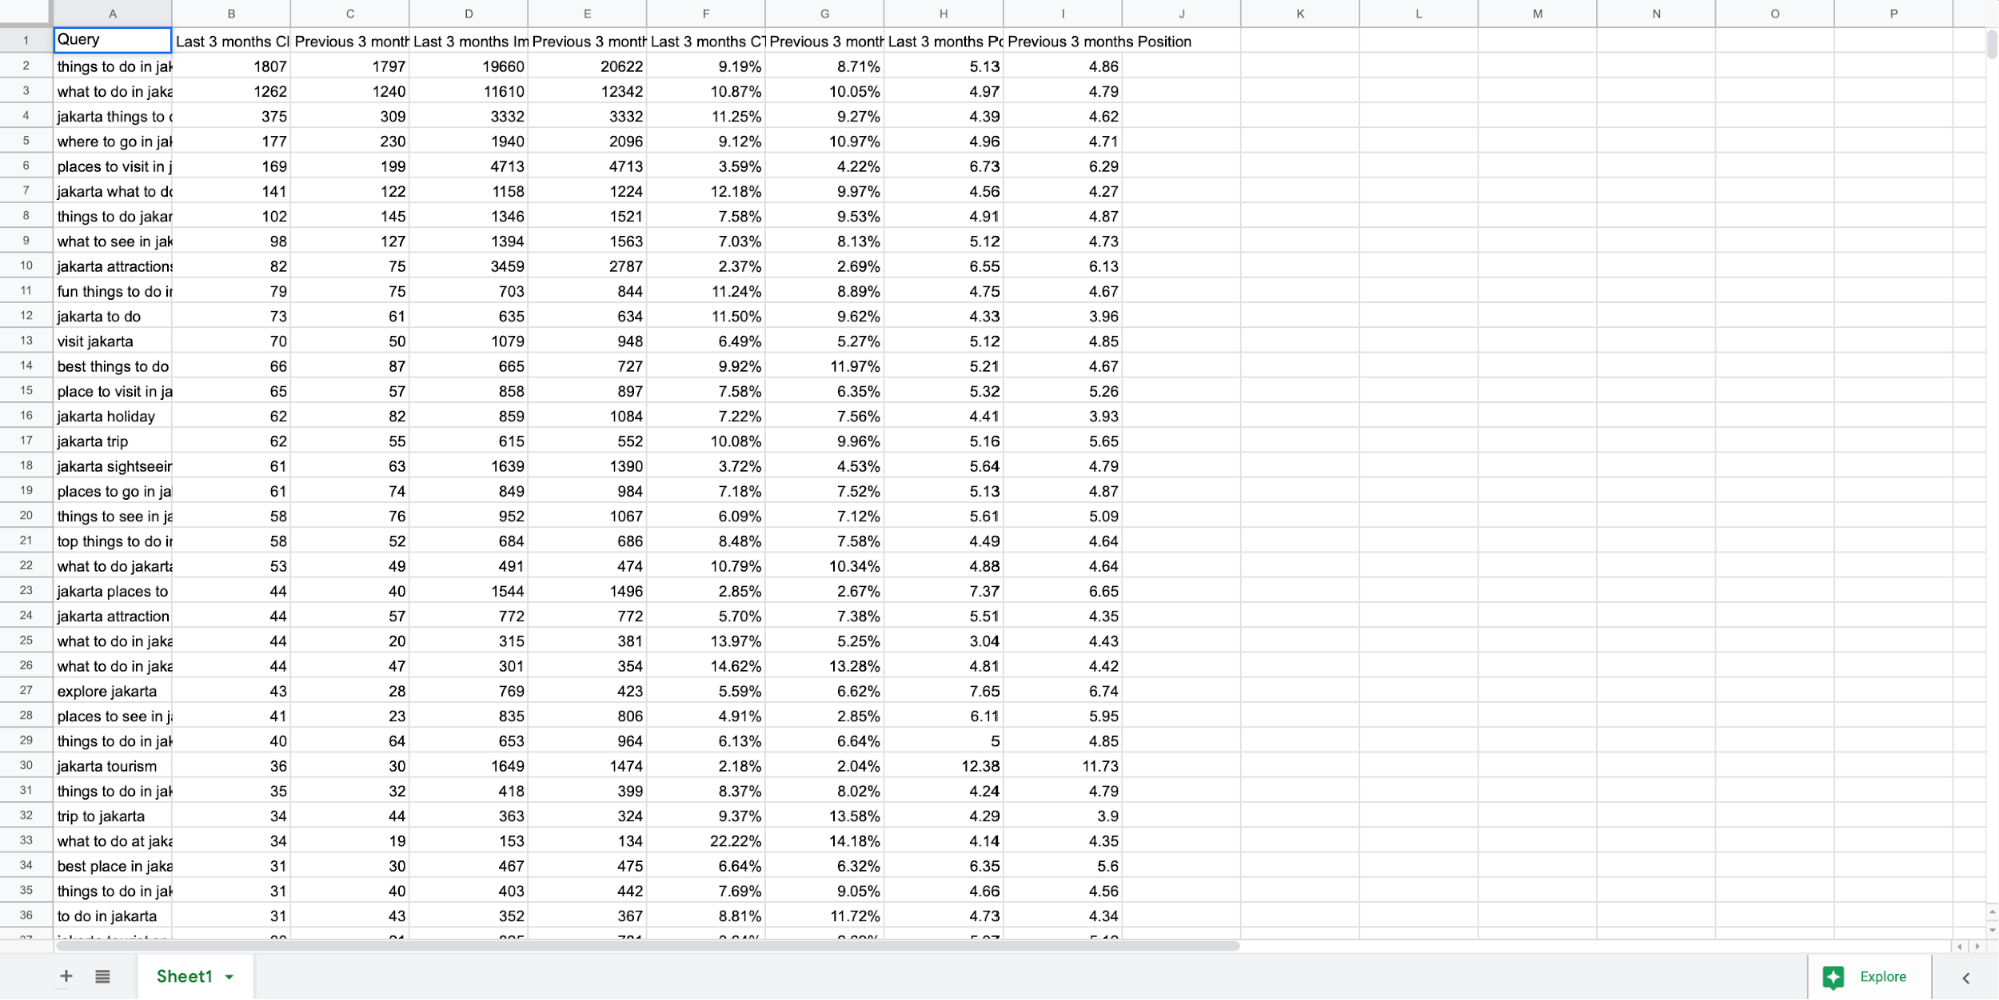
Now, we want to see which of these metrics increased or decreased. Select your first available column, and in the first cell, call it Click Change.
Now, in the next cell down, enter the following formula: ‘=IFS(B2:B>C2:C, "Increased", B2:B<C2:C, "Decreased")’.
Copy and paste this formula all the way down the column. Now we can see which queries got more clicks in the last three months and vice versa. Where no change occurs, the cell will display ‘N/A’.
Repeat this process for the three remaining pairs of metrics, making sure to update the column name in each formula.
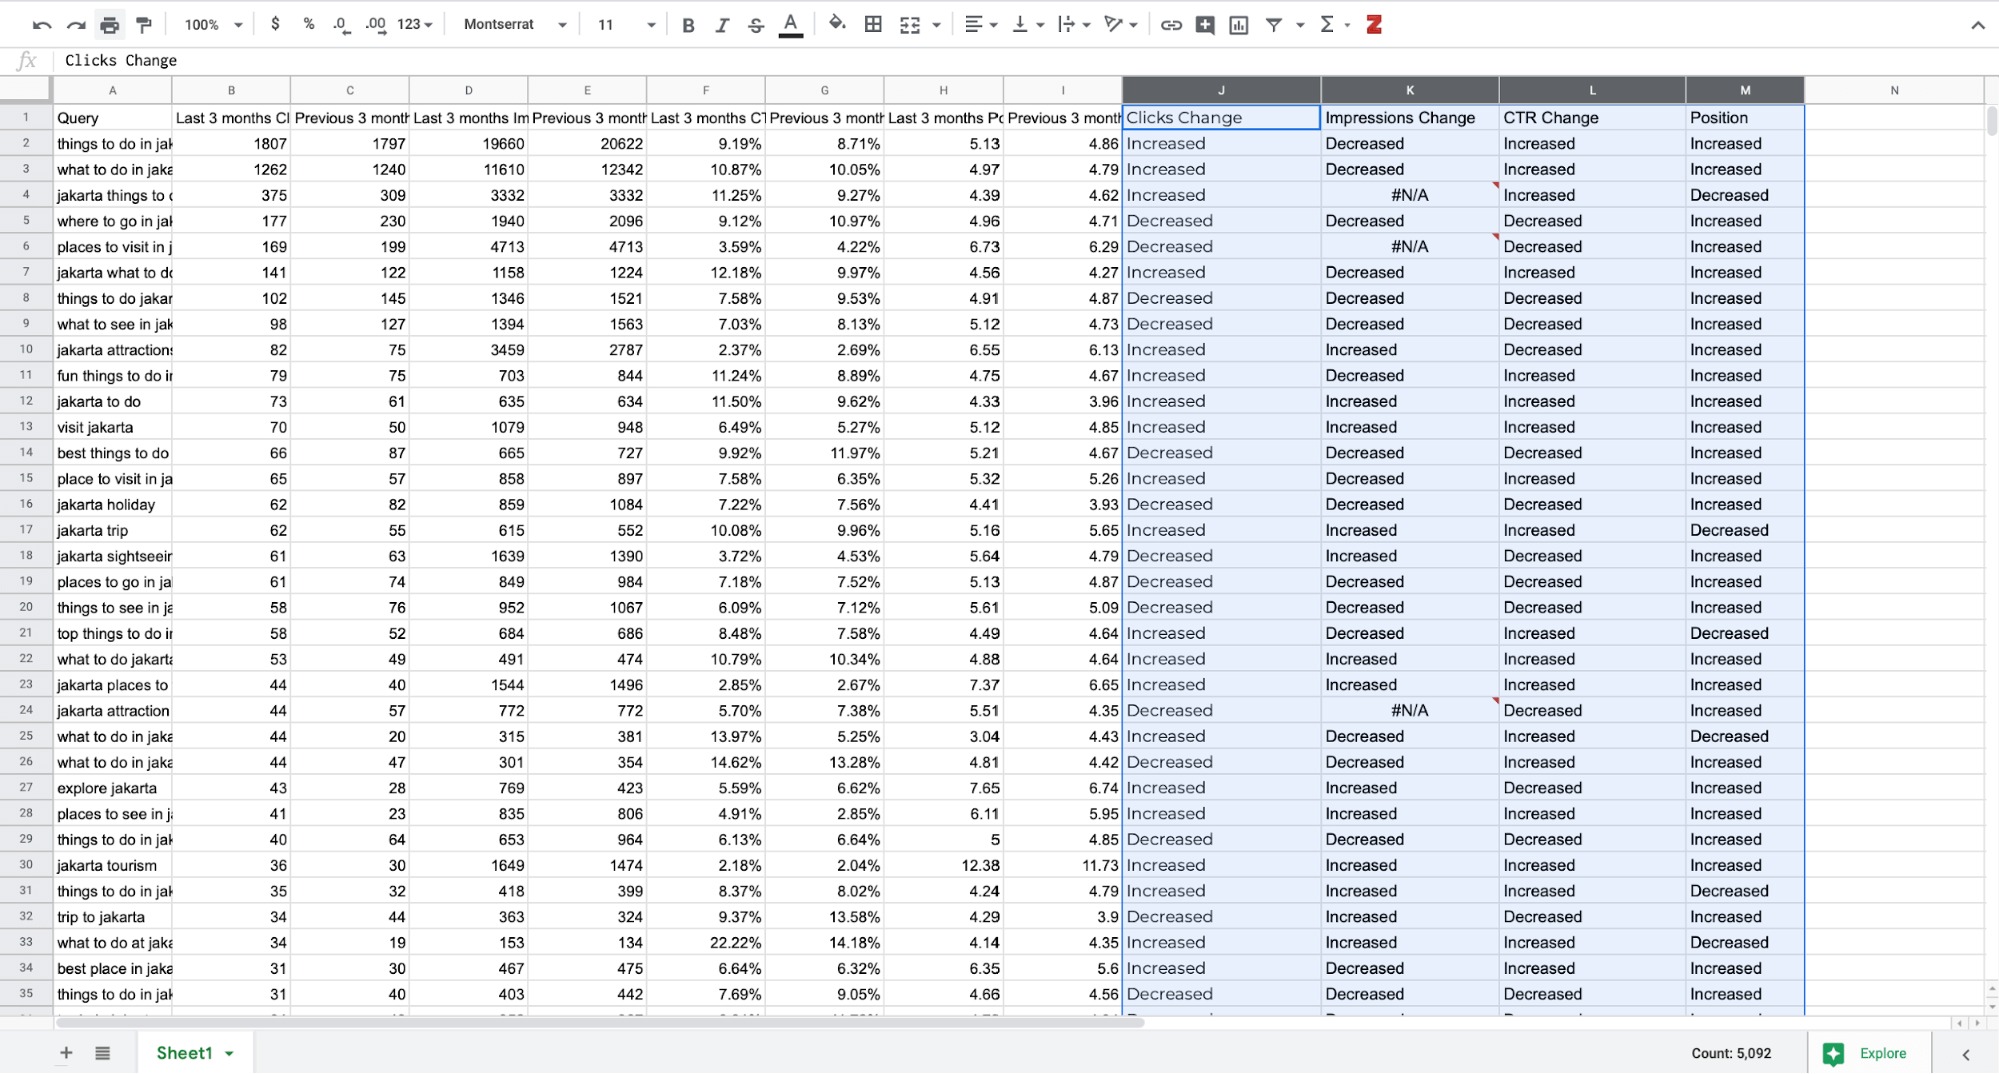
To make this a little easier on the eye, we’ll add some more colour coding with conditional formatting. Just like before, except this time we’ll create two rules. If the value is ‘Increased’ highlight, in green, if it’s ‘Decreased’, highlight in red.
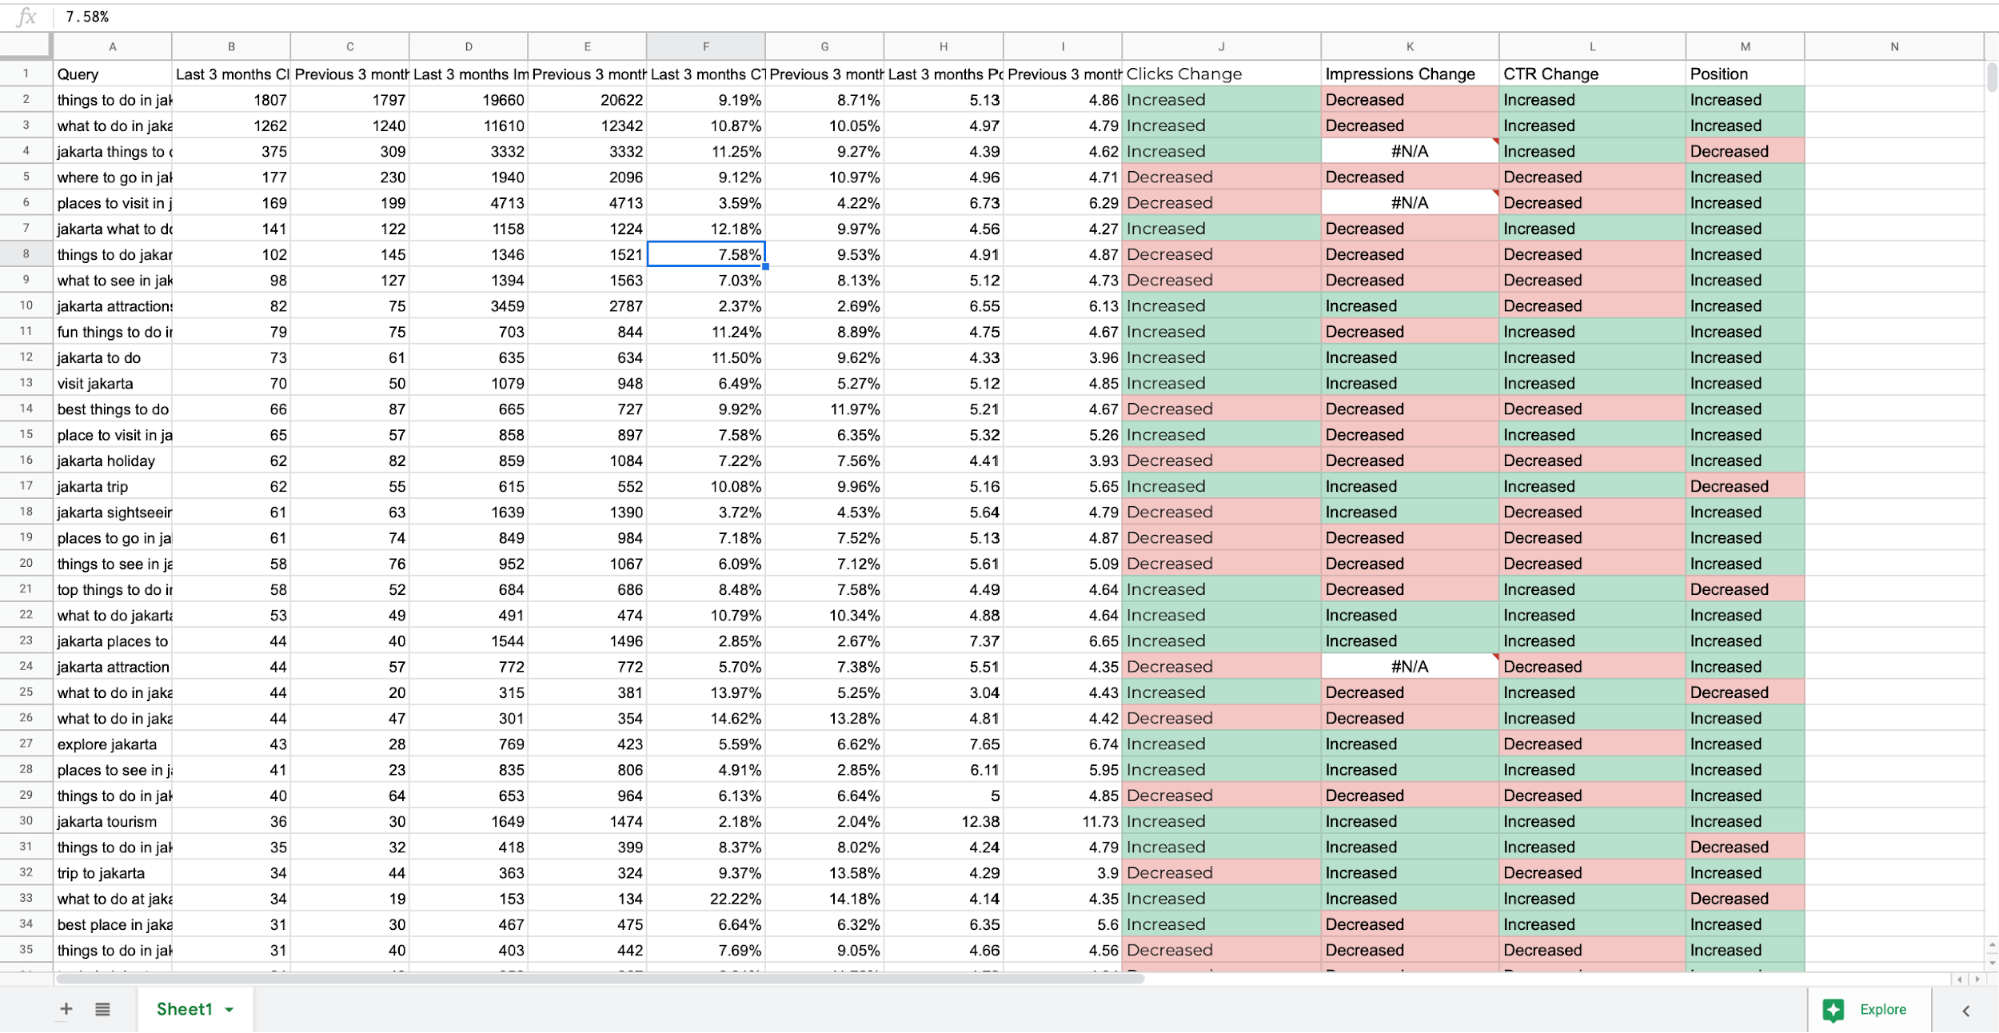
Now you can quickly assess the impact of any changes to your SEO strategy, or Google algorithm changes on each individual search query.
4. Identify and eliminate content cannibalization
Content cannibalization occurs when different pages on your site are competing for the same keywords. This is kind of the SEO equivalent of shooting yourself in the foot. This can be spotted easily in Google Sheets.
Naturally, some pages will have similar keywords. The problem arises when some pages rank for keywords that you don’t want them to and hurt the ranking of the pages which are actually targeted at these.
Head back to the spreadsheet you created for the queries leading to the top pages on your site. This time, copy the date for all the pages into a single tab. Before you add in the data for each page, make a new column to display the page title.
Colour code the page titles, and then sort the data by Query.
Now scan the Queries column and highlight any terms which multiple pages rank for in red.
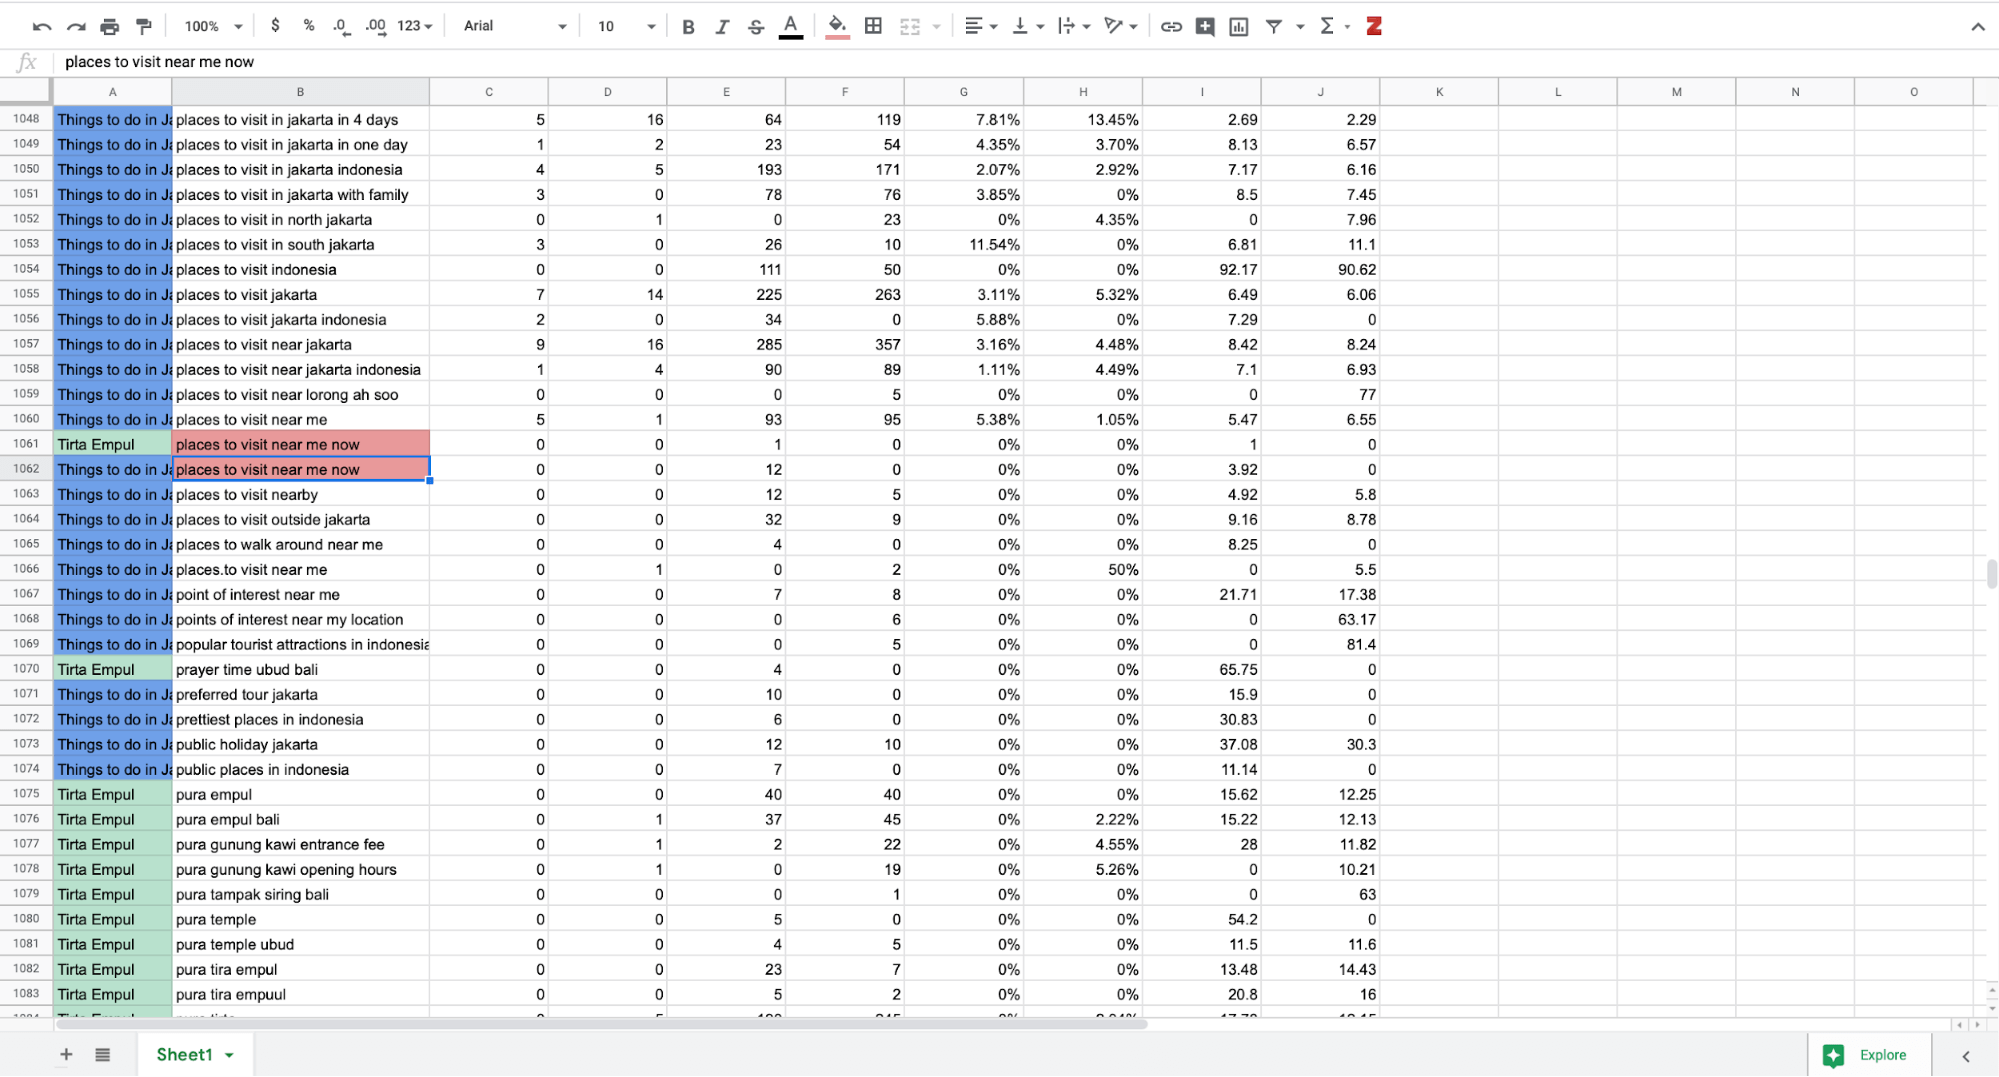
This allows you to determine whether or not the more relevant pages are outranking the others for a certain keyword. If this isn’t the case, you can take action by examining your on-page SEO and the number of backlinks each page has.
5. Compare performance across devices
Finally, let’s look at how to analyze page performance by device, with a view to identifying optimization issues. Select the page you want to analyze, and using the Device filter in Search Console, export the Queries data for Mobile, Desktop and Tablet.
You’ll then need to compile these into a single spreadsheet manually with an extra column to display the device. Once again, we’ll colour code these using conditional formatting.
Your goal is to find queries where one device is significantly under or overperforming. This indicates that there’s some kind of optimization issues for those users. For example, check out these highlighted cells.
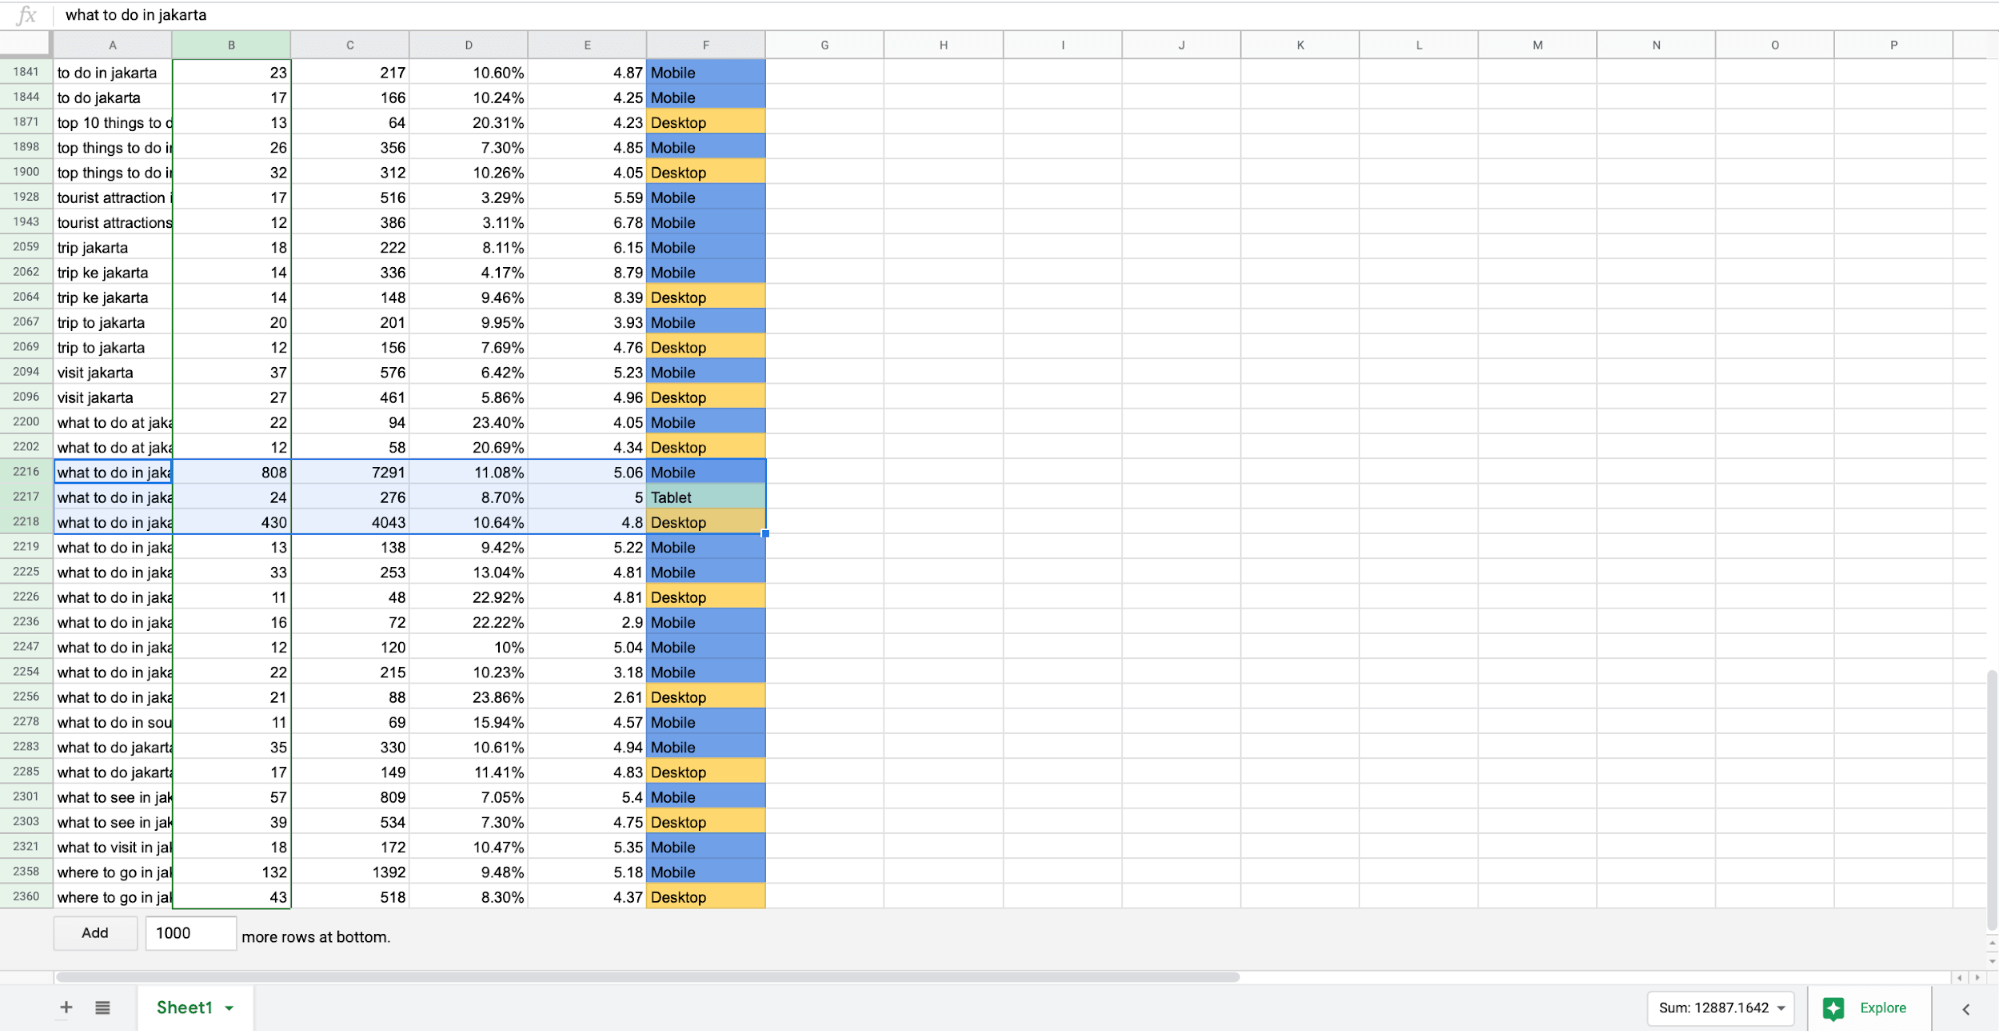
Now, the number of users searching on tablets will pretty much always be lower, which explains the low figures here for Clicks and Impressions. What’s important is that the CTR for tablets is significantly lower than mobile or desktop, despite the Average Position being about the same.
This indicates meta-data which is poorly optimized for tablet users. To bump up this CTR and take advantage of the high Average Position will require a better meta-description and meta-title.
It’s often helpful to create a filter to exclude tablet data and focus on the disparity between your page’s performance on mobile and desktop.
Managing SEO tasks in Google Sheets
In this article, we’ve looked at just some of the ways Google Sheets can be used to make your life easier when managing and reviewing SEO tasks. This has included how to find keywords that need more attention, as well as how to get the best performance out of them.
We’ve also looked at how to improve on-page SEO, avoid content cannibalization and find optimization issues you might otherwise miss. And of course, we looked at how to measure the results of any actions you take thereafter.
Now, you can apply the same techniques to analyzing SEO data in just about any other way you might want to. As they say, knowledge is power.
Nico is an online marketer and the founder of
Launch Space. He helps companies develop their digital marketing strategies. He’s worked with everyone from Fortune 500 companies to startups, helping them develop content marketing strategies that align with their business goals. Follow him on Twitter.