A tutorial on Facebook's updated business page insights
I was very excited to finally get Facebook's new Insights rolled out last week. Well worth the wait.
Not sure if you have the new Insights?
Take a look at your Admin panel and you should see this:
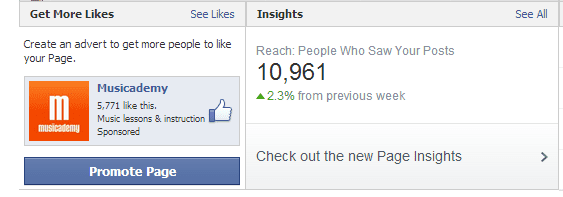
If not, then you are still awaiting the roll out. It's worth hitting the "Check out the new Page insights" button as it will simply tour you through the new features using your very own data.
Facebook describes the update this way:
"Historically, Page Insights has reported on posts' performance, reach, and engagement in three distinct places. In the new Page Insights, we aggregate all these metrics into a post-specific score card, so marketers can evaluate positive and negative metrics together. This will help Page admins better identify content people interact with, produce more of it, and enjoy increased reach and impact on Facebook."
This post is intended as a brief introduction and tutorial to the new Insights including some of the most useful new data - you can work through it comparing to yours.
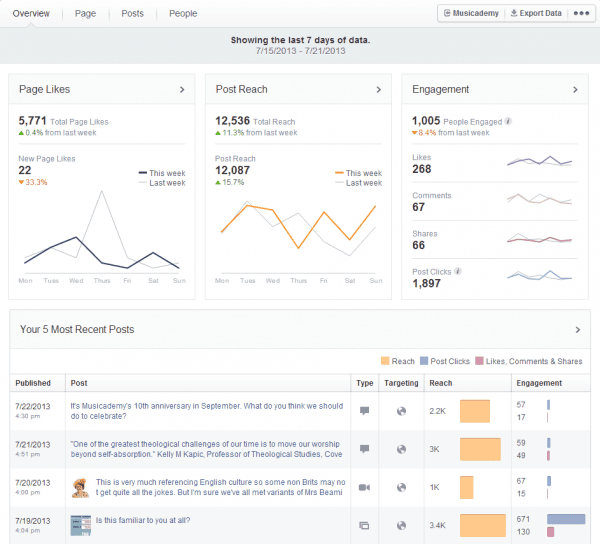
1. Overview Tab
Firstly you get what Facebook is calling an "Overview". It's a dashboard of sorts showing key data from the last 7 days (you can of course select a different date range for specific reports and you can click and drag to select as well as inserting dates into the calendar). On of the first things you'll notice is how visual it is. A nice combination of tables and graphics gives you an instant overview:
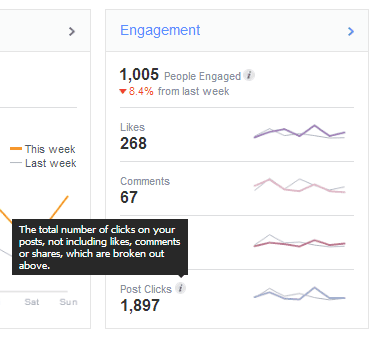
Facebook defines engagement as including all clicks, not only comments, likes and shares so you can see from the graphic below that we had 1,005 of our 5771 audience engaged in the last week. But note how this additional dashboard data now shows how many clicks you received that were not likes, comments or shares.
2. Page tab
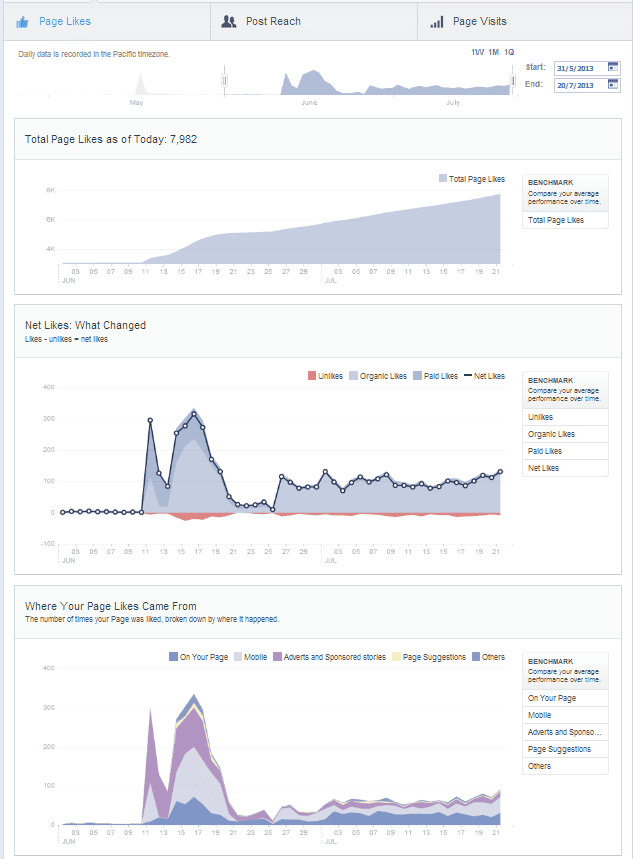
Now click on the "Page" tab and you get three further options to drill down to - Page Likes, Post Reach and Page Visits.
Here I've screen clipped the data from a client page because I wanted to draw your attention to the huge impact that Facebook advertising has on fan numbers. With not a lot of money (but some cleverly targeted ads) we went from 3,000 to over 7,000 fans in just 2 months:
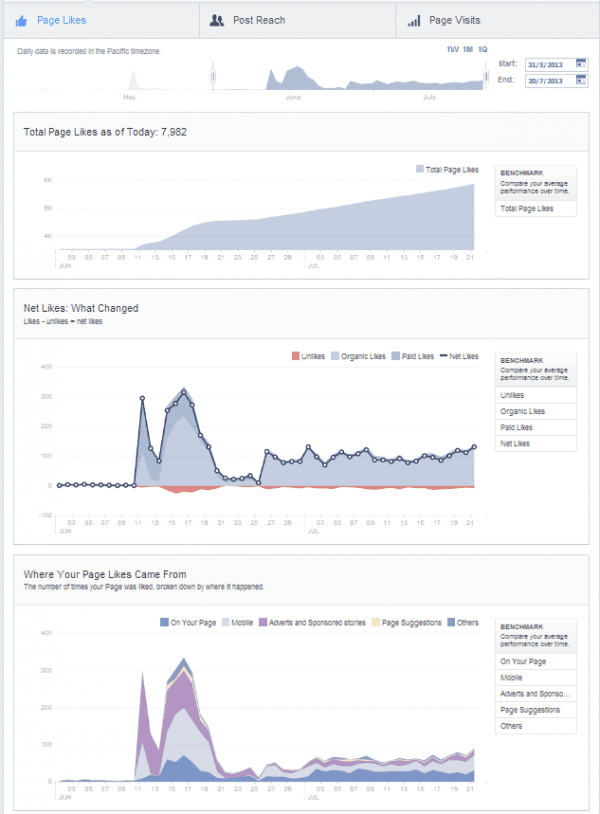
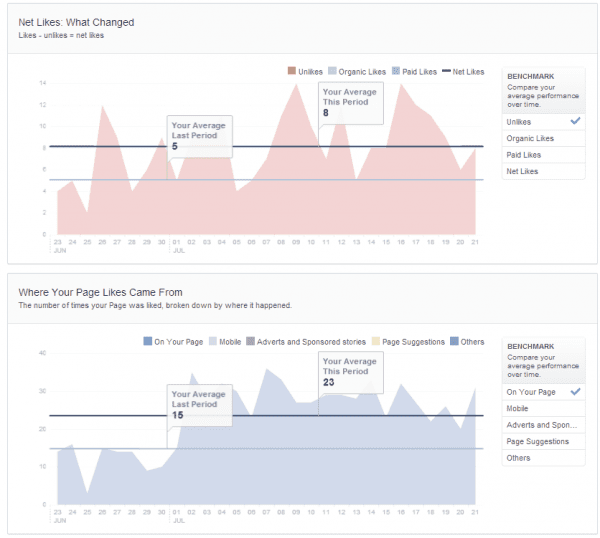
You'll also see a breakdown of organic and paid likes together with the crucial "unlike" numbers. The final graphic shows a breakdown of where likes come from - look at the impact of mobile (pale blue), especially in mid June where we were testing mobile ads.
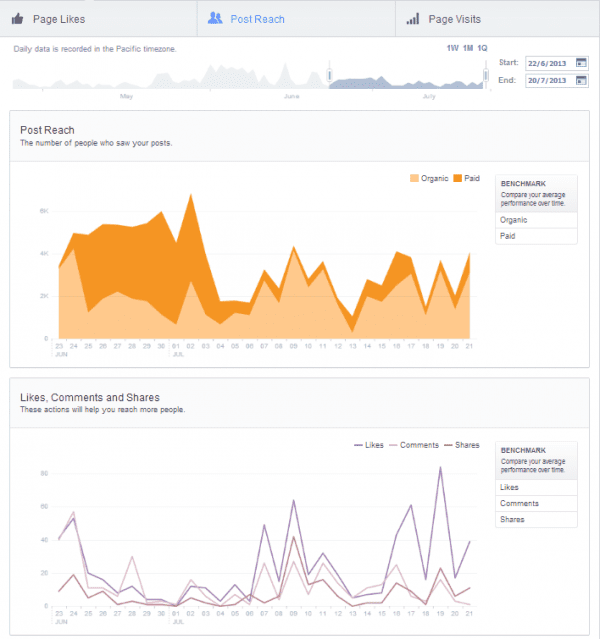
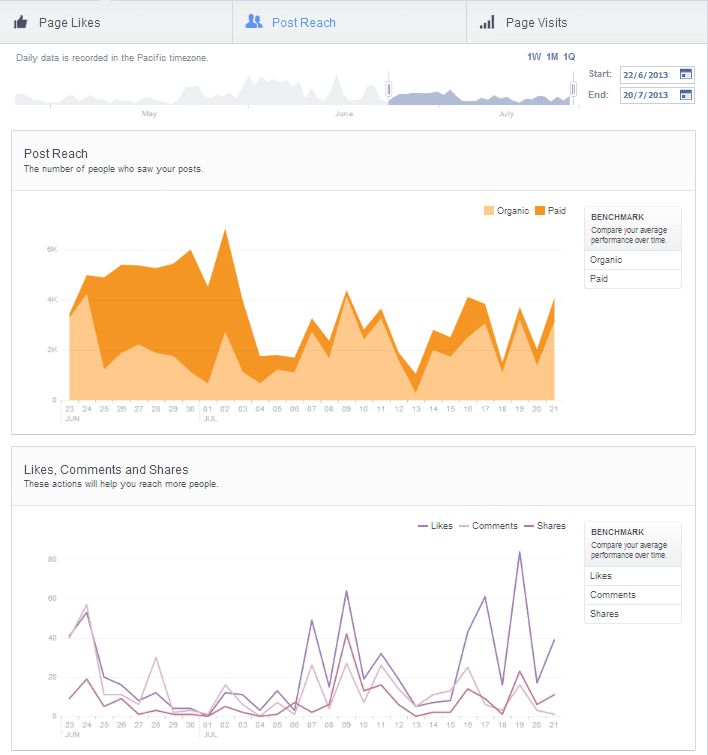
Back to the Musicademy Page to look at the Post Reach data. Here you can see the split between organic and paid post reach. Below that the number of Likes, Comments and Shares:
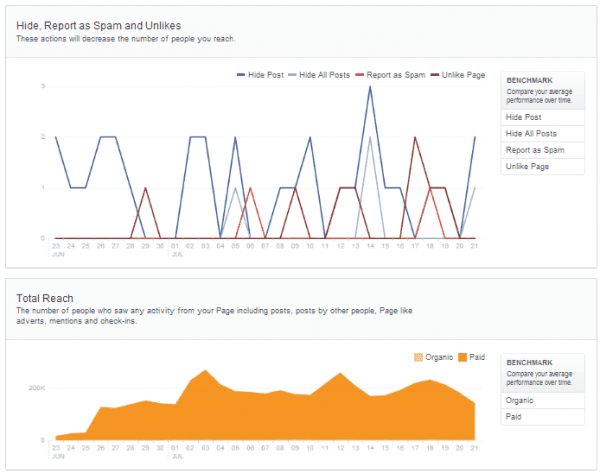
On my client's Page you can see the more negative impact that advertising can have (we've been doing a number of newsfeed Page Post ads to multiple new target audiences) with posts being hidden, reported as spam or the Page being unliked. This is going to be inevitable with significant ad spend but the numbers here are still relatively low:
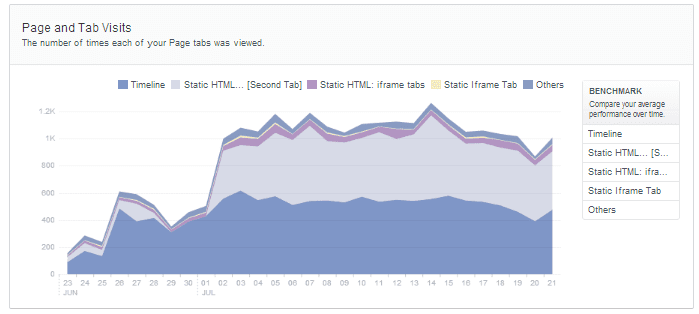
Next you'll come to Page visits. At the top is an analysis of your Tabs activity. Now my client has a number of Apps here (mailing list sign-ups, free downloads etc) so you get to see how each are working:
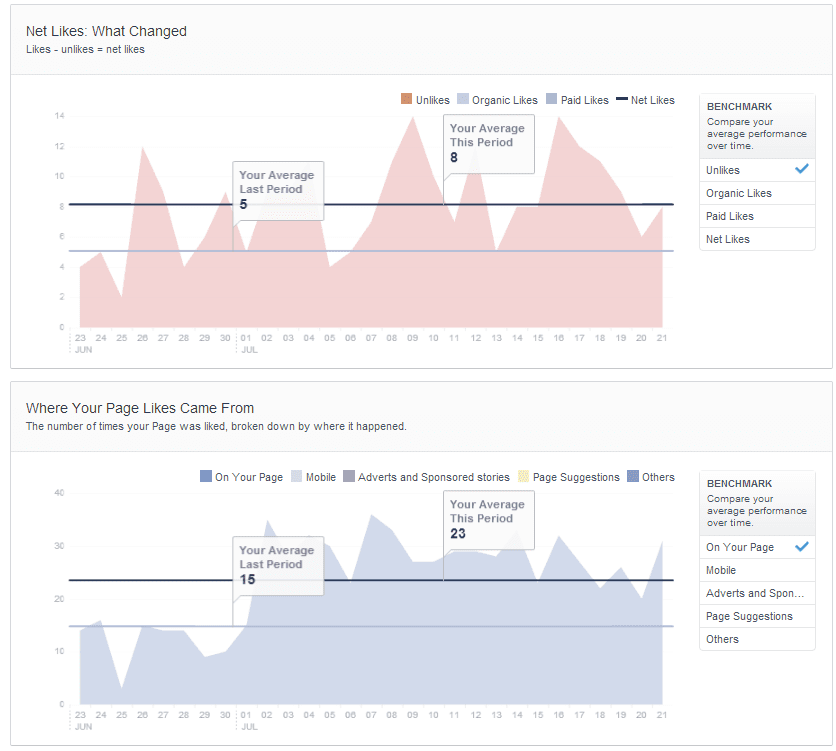
Benchmarks
Another neat addition here is the ability to benchmark your performance over time. Here's my client's benchmark data for Unlikes and Page Likes:
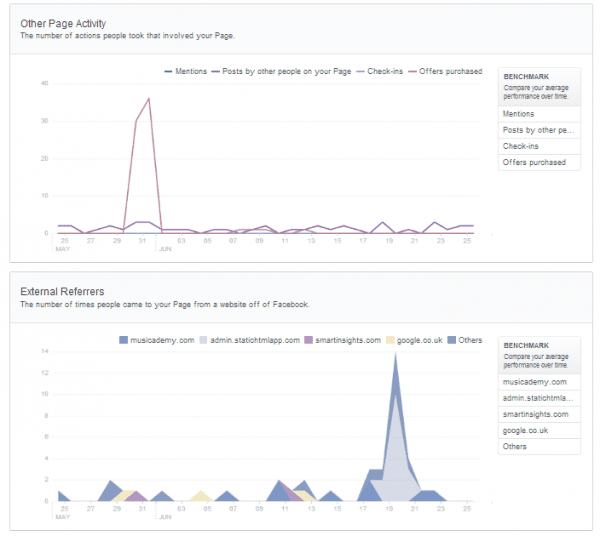
Then other Page activity (you'll note that I'm changing the time frame in these screen grabs in order to bring you items of interest). Back in May Musicademy did a Facebook Offer - that's the big spike.
Below that is the external referrers to your Facebook Page. No surprise that Musicademy's website, our newsletter and Smart Insights (where I write extensively about Facebook) all figure here:
3. Posts tab
Clicking through further you find data on your Posts. The first option is a drill down of individual posts as per the overview page. Here you can further refine to look at types of engagement and reach.
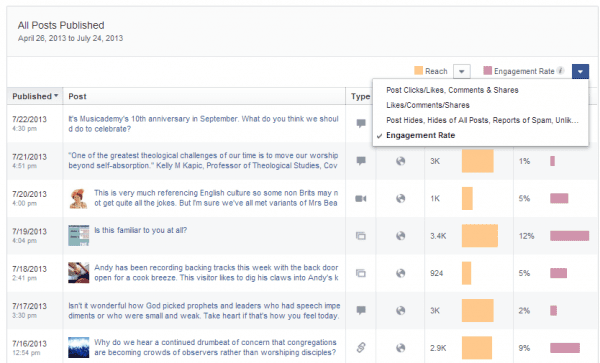
Click on any one of these posts for a further drilldown of data:
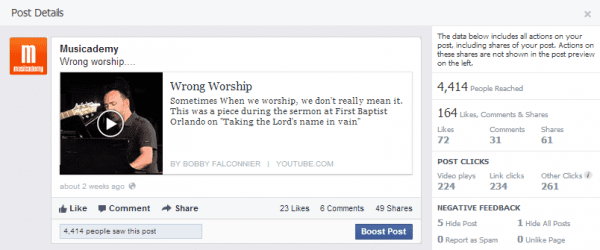
The above is one of the most controversial pieces of content we have posted recently. It's a spoof on a worship song and therefore a subject some of our fans might be rather prickly about. Certainly amongst the many Likes on both the Page and the Blog we had some critical feedback but what was the actual impact in terms of Hides? This graphic shows that 5 people hid the post and one decided to hide all our posts - I wish people would simply unlike the Page - it's impossible at the moment to tell how many of our so-called fans have actually opted out of seeing our content.
So what?
Now we are onto one of my favourite new Insights partly because I'm asked the question "When is the best time to post?" all the time. This Insight shows When Your Fans Are Online. You can see for Musicademy that mid to end of week is best, and that Saturday is also busy. For my client, their data showed a significant increase in fans being on Facebook over the weekend (a time when many companies and agencies fail to post due to the necessity to monitor responses and reply to comments).
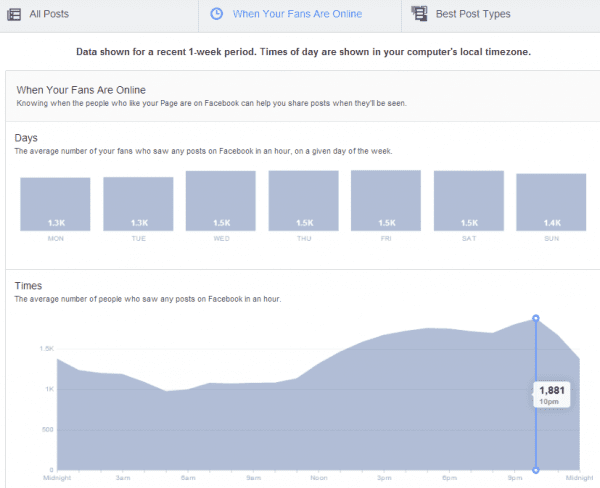
Now over the years I've had to figure out the above information for myself via customer survey, now Facebook tells me the day and time of day our fans are most online. The above profile is typical of a Page with fans in the UK and US. I typically post at about 4pm in order to maximise my exposure to both audiences, but if I simply was focusing on getting to the highest number of fans I would need to be posting at 10pm.
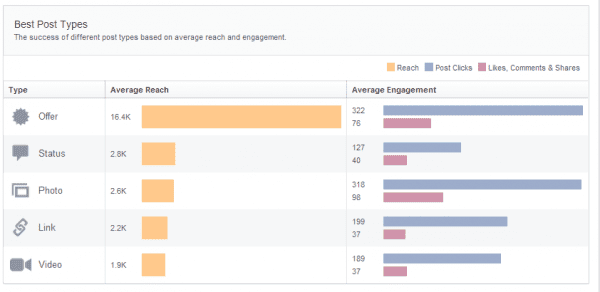
Next is the option to look at what types of post perform best. This has always been possible in Insights but previously it was a case of trudging through a downloadable spreadsheet with scary quantities of data. (Old style Exports are still available and are currently unchanged.) Now you can see performance at a glance:
A few things to note here:
- There's no date range given for this analysis - I suspect it is over several months (partly as we've not posted any offers since June - and Facebook has removed that facility now in any case).
- This is HUGELY affected by EdgeRank. Different post types don't enjoy an average playing field to begin with as nowadays Facebook will more naturally give exposure to plan status updates over other post types.
- I am judicious about my use of photos. They occupy serious real estate, especially on mobile but given they will get less exposure than status updates they need to work in their own right so be very engaging, funny, provocative etc in order to further drive engagement and virality.
- The level of information is not as great as it could be. For instance, you can see how many people have clicked on a link post but not the link itself.
4. People tab
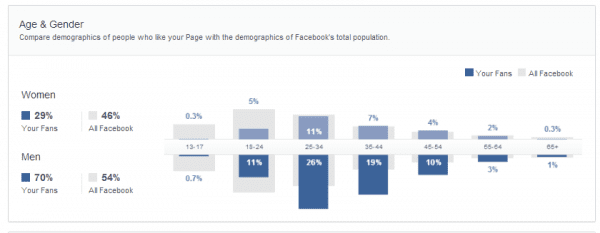
Finally we look at the People Insights
Let's compare the Musicademy audience with my client's:
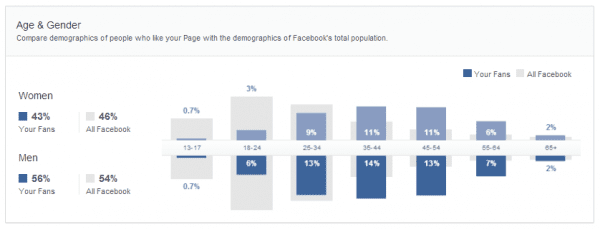
Musicademy has marginally more male than female fans but my client has a much bigger gender divide (it's a tech client so no major surprise there).
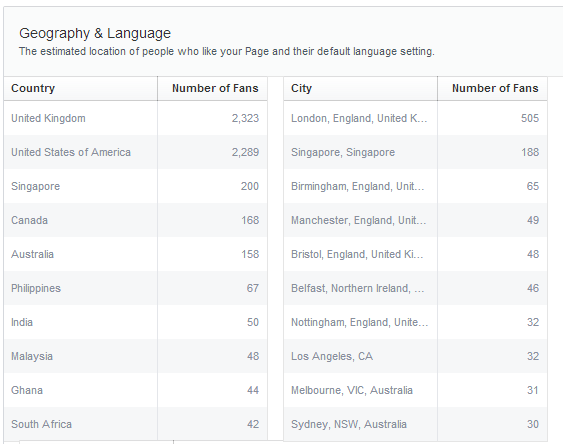
You'll also see a breakdown of fans by country, city and language:
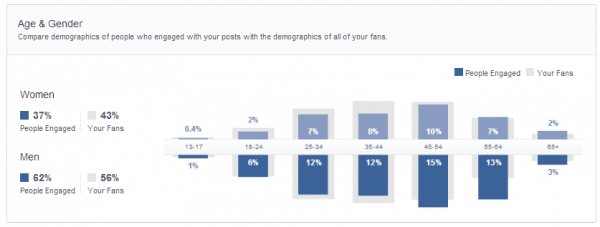
There are further options including an analysis of people reached (as opposed to the fans you have - many of these may be dormant, have hidden your Page or simply not seeing your content due to Edgerank).
I like the Engagement metric. Generally on Facebook women engage more but on the Musicademy Page the men are disproportionally more active.
PTAT
As I wrote this post on 24 July the old PTAT (people talking about this) public-facing number is no longer publicly showing on Pages (although you can figure it out yourself from your Insights if you are so inclined). As outlined above, you can now achieve a far deeper drilldown into activity which is a good thing for any brand that cares about it's analytics. The lack of any of this being publicly available is a shame though in that it was a quick way of looking at a competitor's Page and assessing engagement. Having said that, it was so skewed by advertising activity that brands continually pumping money into advertising appeared to have far higher engagement rates.
I see on 25 July that PTAT has returned. Good old Facebook - changing things, changing htem back etc etc.
What do you think?
Have you had a look at the new Insights yet? What do you think? Is this something you check daily, weekly, monthly, not at all?
And are you still analysing the Export data? I think you should be!