Learn how to use and transform data into actionable insights to improve your conversions for e-commerce
One of the reasons companies fail is that they are unaware of the changes in the economic environment. Statistics are showing that roughly 80% of new businesses survive past their first year of operation. These days, data is the primary currency and driver of growth. Using data and the proper tools to analyze it, we have the power to generate growth no matter the size or age of the business.
Google Analytics for e-commerce template
Google Analytics is a powerful tool, but you need a data-driven mindset to go beyond a simple review of trends in sales figures in Google Analytics to identify techniques to increase revenue. This template is for 'hands-on' use if you're directly involved with using a data-driven approach to improve results from a transactional website using Google Analytics.
Access the Google Analytics for e-commerce template
Transforming data into actionable insights should be the daily aerobics for a company
The problem with these companies is that they sleep on tons of data. They have pure gold in their database: information about customers, visitors, the market, but they are not using it to get actionable insights. To be a data-driven company, you need to have the internal habit (from upper management to every level) to look at the data and generate insights regularly. Every person in the company should understand the importance of his role, the impact he has and the changes he causes.
Being a data-driven company means to be an adaptive, flexible and aware company. The companies that pass the test of time and overdeliver value to the market are not necessarily the biggest, but the ones that are agile and adaptive.
To be an adaptive company, you need to have a clear vision on the direction you are going, why are you heading there and what your mission is. Despite this critical aspect, why aren’t more companies using data correctly?
Why is data so hard to use?
There are three main reasons why data is so hard to use sometimes.
Let’s assume that the company has passed the problem of not collecting data about visitors and customers, and it is continuously gathering up information. To handle data, we have these three problems:
- Huge volume of data. Data is everywhere and it is very hard to work with if you don’t have the proper tools and the people that will digest and correlate the information;
- You need time to collect and process the data. This is where artificial intelligence will come into the picture;
- Lack of strategy from upper management - tracking the wrong KPIs and not focusing on the ones that really matter.
Here’s an interesting and invented KPI to chew on: the capacity to adapt to the market (CAM) - how many changes have we made in the organization, how many data-driven changes have we made in the last month. The upper management and the strategy are not focused on what the reality looks like, being hypnotized about the daily operations and past results, forgetting that the future belongs to the ones that create it.
Where to look for hidden gems in Google Analytics
One of the most reliable and used tools to analyze data is Google Analytics. Let me tell you where to find the hidden gems in GA for your e-commerce website.
First of all, I want to emphasize this: there are no recipes to guarantee success, but there are some guidelines you can follow and some particular ways to grab the data to find the hidden gems in Google Analytics.
You have the dimensions and the metrics. If you are focusing on the right dimensions then it is simple: use good old Pareto’s law. You need a methodology to find the hidden gems in GA. The first step is to look at the main dimensions of your website.
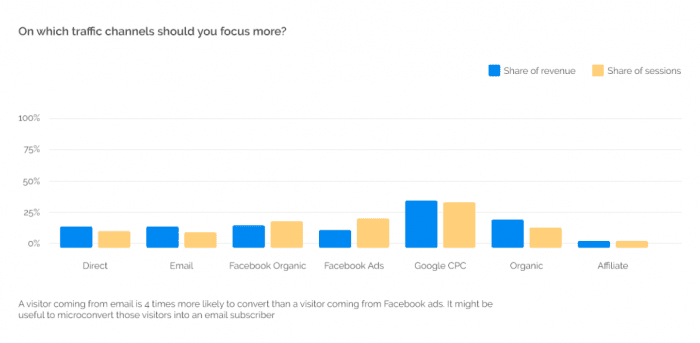
One dimension to analyze is the traffic source. Analyzing the traffic sources you can look to how many visitors are coming from x and y, but let’s pause for a second and think about what the focus of an e-commerce is: the conversions, right? That means the revenue per visitor is the most important metric. So if you are looking at the revenue per visitor and the total revenue, you see the global picture. But, the question is, which are the channels that are generating the highest revenue per visitor?
While analyzing the traffic sources, find out relevant stuff regarding how many sessions or users are coming from a specific channel and how much revenue they are generating.
Other dimensions could be:
- the behavior: returning vs. new visitors
- the technology used by the visitors
But these are only segments. You can go in-depth and discover new sub-segments by combining the behavior, the technology, and the channels. This is a complex process and it is hard to be processed by the human mind - we are now living the last days where data analysts are compiling vast amounts of data, all will be made using artificial intelligence.
I mentioned earlier the Pareto rule. Here is how it works: you take a look at the 20% of the traffic that generates the 80% of your revenue. What I am now suggesting is to analyze the visitors that are converting. Begin with the end in mind and investigate the behavior of the most valuable customers. This type of analysis can reveal important insights: x% of the customers are performing a search, are looking at more than 10 pages in one visit on your website, are adding items in the wishlist or are using a specific filter. Thus, looking at the customer’s onsite path, the landing pages and the exit pages is going to take your business to the next level.
Download our Free Resource – Google Analytics Fast Start - 10 mistakes to avoid
This Free guide brings together a series of common mistakes that we have seen made by both experienced and new Google Analytics alike, grouped into 10 easily identifiable areas.
Access the
Which are the most important findings that I discovered in my 10 years experience in the e-commerce industry?
The most important thing you should be looking for in GA is an anomaly - things which are not supposed to be there. For example, you can discover that the website is not working on a type of browsers - you have 0 conversions from 4% of the traffic.
Another finding is related to the behavior. Focus more on the behavior and not so much on the traffic source, because you want to identify the favorable behavior, amplify it and make the other visitors have the same pattern on site.
What is the next methodology to be a data-driven company
Accurate tracking
The pillar of a data-driven business is to make sure that your tracking is correct: your GA is correctly implemented, you are getting rid of the robots, you are filtering spam. You are tracking your visitors very accurate.
Data analysis
The next step is to analyze the available data. Having someone in your team with this role is not optional anymore.
After this part, you transform the results of the analysis into actionable insights that will help you create hypotheses. Remember that it is useless to have insights which are not actionable. Now, prepare hypotheses that are reliable and based on data. I have seen too many optimizers and digital marketers doing new experiments based on guts. That is not the way to do it: you have to ask yourself what is the hypothesis behind every experiment or what is the data-driven insight that brought you to a specific hypothesis?
Once you have clear hypotheses, prioritize them based on any type of structure: pie charts (from Widerfunnel), potential impact and ease score. Turn your hypotheses into experiments. Whether you are doing an AB test, a web personalization or an NPS survey make sure the experiment is deployed and the KPIs are measured correctly.
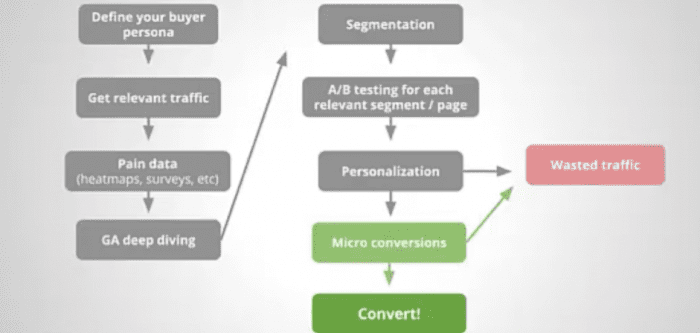
This is a visualization of the advanced methodology:
In the end, based on your way to interpret the data and decide if an experiment is a winner or not, you should understand the difference between frequentist or Bayesian statistics. At Omniconvert we have two types of approach: small websites can rely on Bayesian statistics and websites with high volume of traffic can use the frequentist statistics.
After all these steps, it is time to see the results and find out if you had a winner or a loser experiment. I strongly believe that an experiment is a loser only if you do not analyze it and do not learn anything from it. Sometimes you win, sometimes you learn. Education is an important step in your methodology.
In case you have a winner, get the insight and journal all the optimization story behind it. The thing is not to stop here with the winning experiments, but to go further and do the post-experiment analysis to make sure the result wasn’t a false positive. Relying only on the experiment’s time frame is not solid and might give you an illusion about the real situation.
To sum this up, there is a way to grow your business using data. You just need the right tools, the right methodology, and the right people. If you want a tool that can empower you to gain instant value for your e-commerce, we have launched an automated conversion rate optimization insight generator based on Google Analytics.
Even if you are working as a manager, digital specialist or CEO, chances are that you are pissed off by the growth rate of your company. To improve this crucial metric, you will need insights. It comes to my mind now the famous quote from Jim Barksdale, former CEO of Netscape “if we have data, let’s look at data, if all we have are opinions, let’s go with mine!”.
All in all, make sure to have data and insights to change things around you. You cannot grow professionally unless you change your ways and environment.

Thanks to Valentin Radu for sharing their advice and opinion in this post. Valentin is a serial entrepreneur and visionary involved in tech and digital marketing for the past 12 years. He is the founder of
Omniconvert, a growth enabler tool for mid-size e-commerce websites looking to become customer-centric. Omniconvert is a conversion rate optimization platform that combines the power of AB testing, web personalization, web surveys using an advanced segmentation engine. Valentin is known for his unyielding positive energy, creativity, and knowledge about marketing and business. He is also an international keynote speaker. Most of the times he talks at conferences about e-commerce, optimization, and growth. You can follow Valentin on
Twitter or connect on
LinkedIn.