Merchants Double Google Shopping Traffic between Q4 2012 and Q1 2013
May 2013 Update - continued growth in Google Shopping Traffic in the US
Each quarter, CPC Strategy rates the top comparison shopping engines including Google Shopping, based on seller metrics such as traffic and revenue.
Contrary to the traditional seasonal trend of increased volume on Google Shopping during Q4, followed by a decrease in volume for Q1, Google Shopping traffic has not slowed into Q1 2013. Instead...
Google Product Listing Ads flipped the typical seasonal trend on its head for Q1 2013, with an increase in traffic which nearly doubled from Q4 to Q1.
Merchants double up on Google Shopping Traffic Between Q4 2012 And Q1 2013
This continues a trend from Q3 to Q4 where we saw an 87% increase in traffic which was to be expected given the progression of the new program in conjunction with the Q4 holiday season but what was surprising is the trend basically continued with an 82% increase from Q4 to Q1:
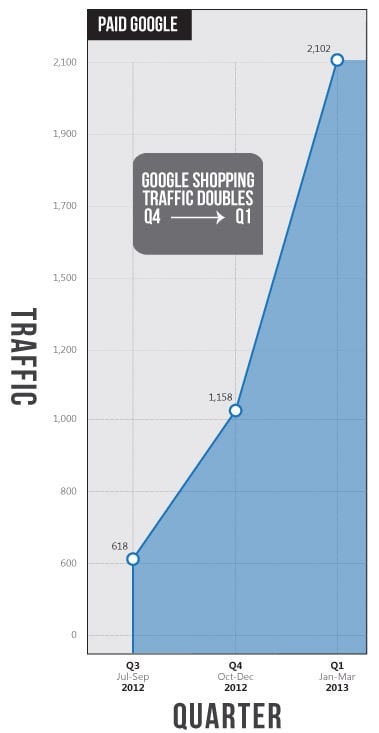
Average Google Shopping Traffic grows twofold after the holiday
When our CEO Rick Backus saw the Google Shopping traffic data, his initial comment was: 'It’s pretty surprising to see the traffic double. That’s nuts'.
If you are in e-commerce, online marketing, or retail in general you’re familiar with the trend of purchases increasing during the holiday season, or Q4. Generally, shoppers purchase more leading up to and during the holiday season. Then during Q1, retailers typically see a decrease in sales.
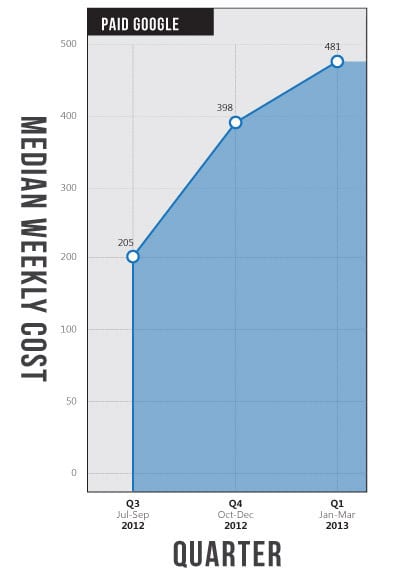
As a result Google Shopping’s increase in traffic after the holiday is an unusual trend to say the least. During this same time period, costs also increased by 21%:
Reasons why weekly Google Shopping Traffic doubled from Q4 To Q1
So why did Google Shopping traffic increase so significantly following the holiday?
Google is ramping up its exposure of Product Listing Ads (PLAs).
How do we know this?
- 1. Since Google Shopping became paid, traffic has doubled each quarter.
- 2. Google has replaced their free placements with paid ads.
Since the transition of free to paid Google traffic, we’ve not only seen a spike in paid Google traffic, but also a corresponding major drop in free traffic as well.
Here is a look at how average (median) weekly revenue from free Google has compared to paid Google traffic since Q2 2012 (when all traffic was free):
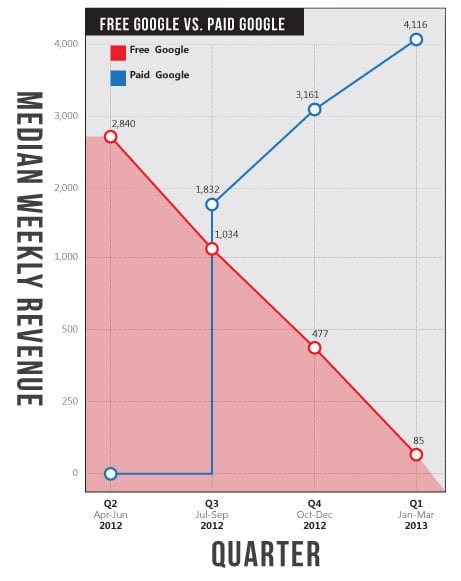
The bad news is revenue that merchants were getting for practically free is basically non-existent. The good news is the sky is now the limit for potential revenue.
- 3. The maturity of the Google Shopping program gives Google more information over what search terms from users should trigger PLAs. In turn this allows them to more accurately display product ads based on users’ purchase intent.
If you are an online merchant and you’re not listing on Google Shopping, now is certainly a time to take a look at the traffic growth data and consider it. For those currently listing on Google Shopping, take the time to optimize your Google Shopping campaign ad structure and revisit your data feed quality.
Battle of the Giants - Google Shopping vs. Amazon Products Ads in Q4
In the arena of comparison shopping, just about every merchant knows that the real titans of industry are Google Shopping (and Paid Product Listing Ads, PLAs) and Amazon Product Ads (APA). The former boasts a newer comparison shopping engine (CSE) backed by the undisputed #1 search engine in the world, while the latter is a pioneer in the e-commerce world and vaunts perhaps the most dynamic and innovative approach to online retail.
So the logical business-oriented mind would ask, “What’s the bottom line here? Where should I put my money?” CPC Strategy has been analyzing the performance from each major CSE in the US for the last several years. Particularly in the last Q4 2012, the data has proved quite revealing and has implications what other countries will see as Google Shopping rolls out more widely.
Through an analysis of significant retail metrics such as conversion rate, traffic numbers, and average cost per click, we begin to see that though Google and APA are constantly duking it out for e-commerce domination, one giant was the clear winner during the Holiday Season. Let’s look at the numbers.
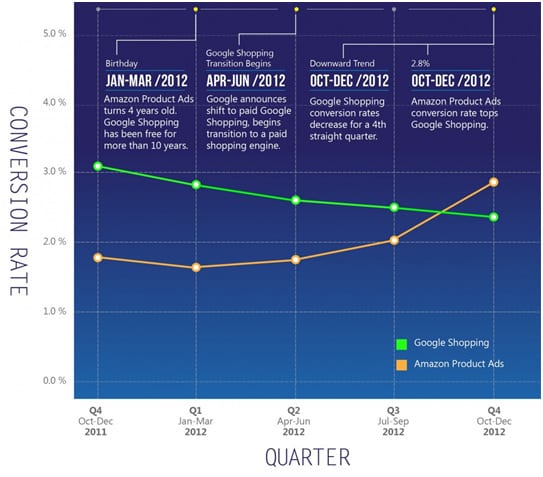
What’s somewhat alarming here is that Google Shopping’s conversion rate has been consistently decreasing since Q4 2011, where it stood at 3.1%. In Q4 2012, we see that number decreased 22.35% to a conversion rate of 2.4%. Why the downhill slope? One could speculate that the gradual switch to a paid engine is to blame, where retailers’ relative bids now affect their products’ exposure.
Conversely, Amazon had an overall conversion rate of 1.8% in Q4 2011, which stood as a significant weakness when compared to Google’s 3.1%. However, that number has been very steadily increasing to a conversion rate of 2.8% in Q4 2012. That’s a 57.5% increase in just one year.
Winner: Amazon Product Ads with a Q4 2012 CR of 2.8% vs. Google’s 2.4%
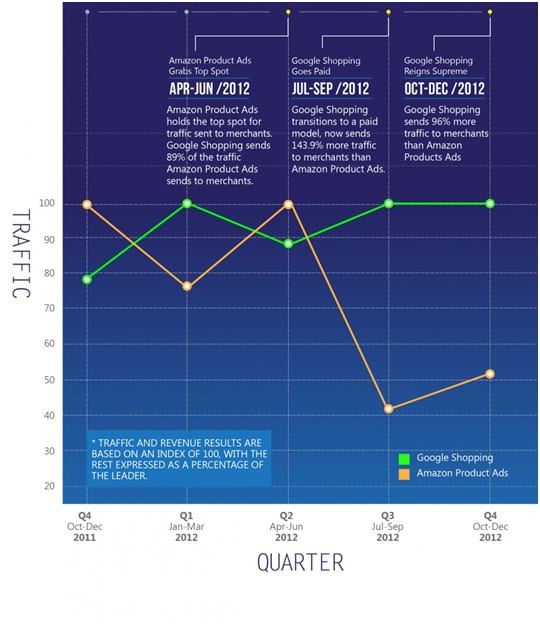
It’s quite clear that Google Shopping’s traffic has been consistently good over the last year. In Q4 2011, we can see that they started out under Amazon, but as the switch to a paid model began to take effect, the traffic growth has been almost exponential.
It looks like from Q2 to Q3 Amazon’s traffic just plummeted, but this is NOT the case. The reality is that Google Shopping sent 144% (that’s more than TWICE) more traffic to online retailers than Amazon, and so Amazon’s traffic is proportionally less. In Q4 2012, Google Shopping sent 96% more traffic to retailers than Amazon did.
Why the discrepancy? Google’s transition to a paid model also started to encourage other CSEs, like Shopzilla and Shopping.com, to advertise their products on the Google CSE. Consequentially, much of their traffic was directed to Shopping.
Winner: Google Shopping with 96% more traffic sent to Merchants than Amazon in Q4 2012.
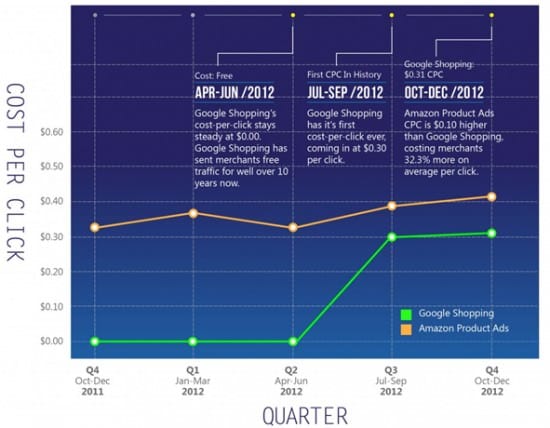
An analysis of the average CPC tells us a couple of things. First and foremost, Google Shopping didn’t record a single CPC charge until Q3 2012, averaging $0.30. CPCs are new territory for Shopping. Second, Shopping was able to keep their CPCs down. In Q4 2012, Google’s $0.31 CPC was 32.5% cheaper than APA’s $0.41 CPC.
Winner: Google Shopping with a $0.31 average CPC vs. Amazon’s $0.41 average CPC
Conclusion
We haven’t painted the whole picture here. There are still other significant metrics such as revenues, engine responsiveness, and cost of sale (COS) that need mentioning. From the full rankings report (to be released next week on the CPC Strategy blog), however, it becomes quite clear that Google Shopping is the clear front-runner among paid CSEs.
Despite it's still relatively infantile state, Shopping just about stole the show during the holiday shopping season rush in Q4, and Merchants certainly need to start making some serious optimizations to their holiday Google Shopping strategy for next Q4.

Mary Weinstein is Content Manager at
CPC Strategy, a full service shopping feed management agency for online retailers. Along with managing comparison shopping accounts and advising online merchants, Mary specializes in inbound marketing and curating content for the CPC Strategy blog. Thanks to Mary for sharing her advice and opinions in this post. You can follow her on
Twitter or connect on
LinkedIn, or on
Google+.


