If you’re not measuring what happens after your visitors buy, you’re missing the additional revenues that these metrics drive
Many e-commerce stores seem to have a ‘one and done’ approach. They focus all their time and marketing dollars on getting prospects to their door, convincing them to shop, then getting them to buy. But then, after that first purchase, they just hear the sound of their marketing engine winding down.
If this is the case for you, your acquisition costs — whether SEO, PPC, or other channels — all go towards this one transaction, rather than being spread out over multiple ones. This obviously this gives you a lower ROI on your acquisition marketing investment.
Download our Individual Member Resource – E-commerce success mapping
This template includes a brief description of the technique and a full example template is provided for the range of levers that can be used to improve performance for an e-commerce site.
Access the E-commerce success mapping
This shouldn’t be your philosophy if you want to grow things like customer lifetime value (CLV), or even the value of a follow-up transaction. This is where post-purchase metrics come into play.
Here I describe the four must-have metrics for tracking the performance of your marketing efforts after that first transaction. By using one or more of these metrics, you’ll not only see your revenues grow but also your brand loyalty, in the form of more direct (and free) traffic to your site.
Metric 1. Per-channel Return on Investment (ROI)
I’ve seen many a marketer become enamored with multi-channel marketing campaigns. They have a team for all digital marketing channels: SEO (or Organic), PPC, Social Media, Email and others.
Each team is humming along contentedly, running their own campaigns. They each have their own favourite metrics, like cost per acquisition (CPA), return on ad spend (ROAS) and retargeting rate.
But I often find that they’re not systematically optimizing the returns they earn on their ad spends. These ROIs are the metrics that matter most to growth-oriented executive teams.
So the first thing you should do for each of your completed transactions is to ‘look upstream’; analyze your conversion funnels to see how each of them is doing.
Calculations needed to track Per-channel ROI
To calculate per-channel return on investment (ROI), gather data for and calculate these channel funnel rates:
- Traffic click to category click-through rate
- Category click-through rate to product page views
- Product page views to product adds-to-cart
- Adds-to-carts to checkouts
- Checkouts to purchase transactions
Then review these data to determine:
- Which of these funnels are ‘widest’ - have the highest click-throughs for each step.
- Which require the least overall cost to support.
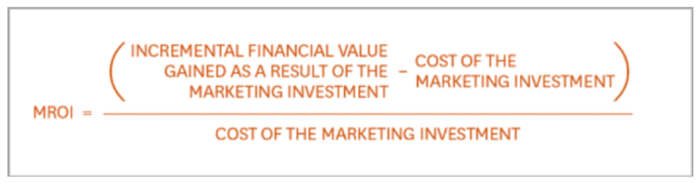
When calculating costs, be sure to include all costs (staff salaries, campaign development, user experience / creative, ad costs). Then compute that most wonderful metric of all, ROI, for each marketing channel:
(Revenue Earned - Costs Incurred) / (Costs Incurred)
Then invest more budget in the channels that are working.
Seems simple, right? Then why do so few do it? Because they’re focused on working within their own marketing campaign silos.
Don’t let this happen to your teams: Take off the blinders and focus more on per-channel ROI and you’ll understand the metric that shows your most efficient paths to conversions, and thus the ones you should invest the most time and money in.
Fortunately, these calculations are ‘baked into’ most web analytics applications like Google Analytics (GA). If you don’t already have some proficiency with GA or your analytics suite, it’s time to get access to an account and spend a few hours digging around. And you might even want to spend some time shadowing your resident Analytics lead.
To dig further into acquisition marketing ROI calculations, see this recent Smart Insights article. The article includes specific steps for setting up conversion ROI tracking.
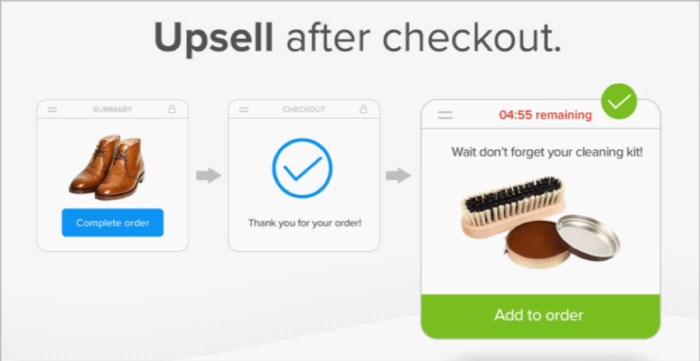
Metric 2. Upsell Rate (UR)
The Upsell Rate (UR) is defined as:
The percentage of purchasers who purchase a product or accessory that’s related to the ‘base’ product (the main product previously purchased).
As the name implies, in order to increase this rate, you need to first define, in your database and/or your merchandising platform, what upsells should be linked to the base product.
As a general rule, these upsells should:
- Be a product or accessory that complements the base product (for example, a helmet or gloves to accompany the purchase of a new bicycle).
- Be a product/accessory whose price point is less than 15% of the price of the base product (a higher percentage is more likely to trigger ‘price pain’ in the human brain).
- Complete the customer’s desired solution — that is, give her a more complete and convenient solution.
The last reason is actually doing your customer a favour since, buy purchasing everything at once, she won’t have to expend extra time and effort to purchase the related accessories.
Calculations needed to track Upsell Rate
The first step to measuring UR is to determine your ‘benchmark for comparison’. Then, as you improve your UR, you can compare your ‘new’ rate to your benchmark rate.
For UR, get these benchmark metrics by finding:
- The current percentage of time, with each transaction, you sell a complementary product/accessory.
- The average dollar value of your upsells. Get this by subtracting your revenue per visitor (RPV) from your average order value (AOV). Most analytics apps I know readily calculate these values.
By calculating these values you’ll have your ‘starting point’ for improvement. (By the way, if your current upsell rate is ‘0%,’ don’t worry, you’re in good company. The good news: you’ll likely see a high UR lift quickly.
Once you have your benchmark Upsell Rate, talk with your team to come up with a Goal Upsell Rate. One I often suggest to clients is 15-20%. For most e-commerce shops, raising their UR, and the resulting AOV can significantly grow revenues.
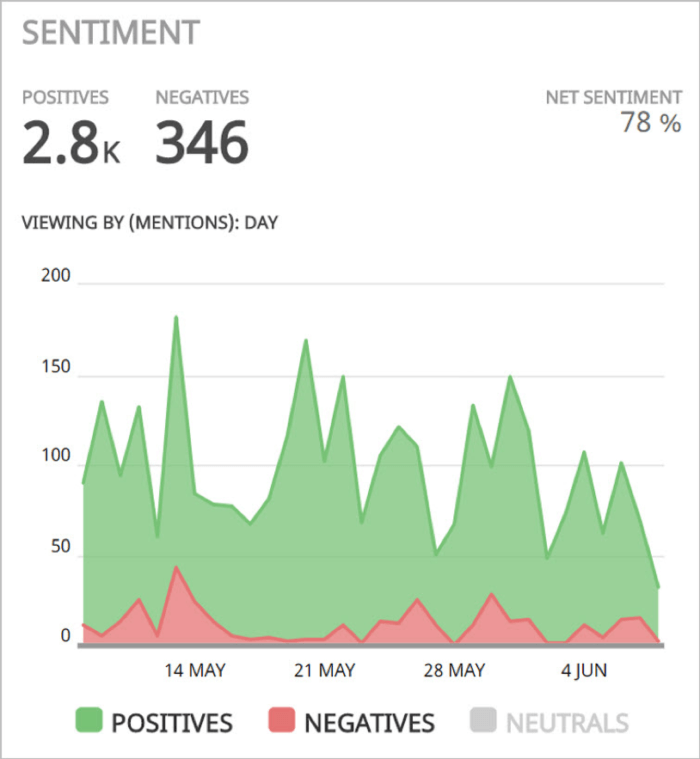
Metric 3. Net Social Sentiment (NSS)
The net social sentiment (NSS) rate is defined as:
- The ratio of positive social sentiment to negative social sentiment
What’s social sentiment? It’s simply what people are saying about your brand — either positive or negative — along with the strength of that sentiment.
Not currently monitoring your social media accounts, or monitoring them regularly? That’s a mistake. Because that’s now where people openly share (or even over-share) their real feelings about your brand or product. And they won’t just share product feedback, they’ll share experiential feedback — how using your product made them feel.
Since we humans are emotional decision-makers, this sentiment, and especially the emotional type, matters big time. New to the latest brain science? This ‘Introduction to Neuromarketing’ article will quickly catch you up.
Bottom line: If you not proactively soliciting social sentiment, you’re missing out on leveraging your most important (and cost-effective) customer insights channel.
Calculations (and apps) needed to track Net Social Sentiment
The first step to measuring SSR is to determine your ‘benchmark for comparison’. Then, as you improve your SSR, you can compare your ‘new’ to your benchmark rate.
For Social Sentiment Rate, get these benchmark metrics by finding:
- The total count of positive comments about your brand.
- The strength (salience) of each positive comment.
- The total count of negative comments about your brand.
- The strength (salience) of each negative comment.
After you have these benchmarks, decide with your team what your SSR goals will be.
If you don’t have hundreds of daily visitors to your social media accounts, you may be able to do this manually. But if you have lots of sentiment pouring in, you’ll want some automated way of analyzing these comments.
Whenever possible, your goal should be able to anticipate bad sentiment so you’re not always in reactive mode. This recent SmartInsights article summarizes how using text mining app can help you do this. These apps have become very capable, so don’t hesitate to plug them into your marketing technology stack.
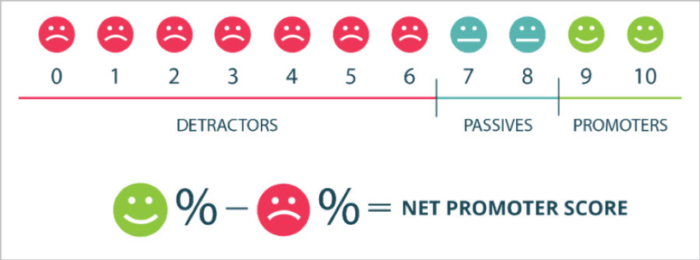
Metric 4. Net Promoter Score (NPS)
I’d be remiss if I didn’t include Net Promoter Score (NPS) in my post-purchase metrics mix.
NPS is defined as the net percentage of promoters of your brand - that is:
- The percentage of promoters minus the percentage of detractors
These percentages are based on how your customers and prospects scored you on the above 10-point scale.
I included NPS as a core customer experience (CX) metric in this SmartInsights post.
Ideally, you should ask prospects and customers to rate their impression of your brand at multiple times, and at multiple ‘touchpoints, such as:
- After making their first purchase (initial NPS).
- After touching your brand a few times (for example, via email, a later transaction).
- After touching your brand many times (hopefully, you get these regular, repeat customers!).
You’re looking for a minimum NPS of 20, and ideally, one that’s 50 or above. That will get you into the ‘excellent’ category.
Even if your initial NPS is low, that’s OK in my book, because at least you’re at least tracking this metric. And you have more upside — the ability to see your NPS improve over time.
Plug in the metrics you can
Just because a customer has completed their first purchase doesn’t mean you should ramp down your marketing efforts. In fact, you should ramp them up.
You should start by understanding which of your acquisition channels yield the highest return on your marketing investment (ROI). To use an automobile analogy, you don’t need an eight-cylinder engine if a turbocharged four-cylinder will do a better job, and burn less fuel (the equivalent of your marketing budget).
Then you should add metrics like Upsell Rate, Net Social Sentiment and Net Promoter Score so you can definitively say whether or not the customer relationship and value are growing over time.
Don’t worry if you can’t put all of these metrics in place right away. Just plug in the ones you can and use them consistently. Soon you’ll be demonstrating that you’re a metrics-driven marketer who’s focused on the bottom line. And this will make your executive team take notice.