7 metrics to calculate web store effectiveness
Lots of marketing techniques can be used to drive traffic to an online store. Marketers for webstores should define the right KPIs to understand which of them bring the most benefit and the highest ROI for the store and which should be reduced or optimised? Here are 7 measures you should consider, many of which are available in Google Analytics.
7 metrics to evaluate marketing channels and online store profitabilty
In this article we have gathered 7 key metrics which will help you evaluate effectiveness of different marketing channels and online store profitability.
Conversion (from Latin conversiō) is the traffic (visits) to the website which ends with some kind of action beneficial for the website – for example, product purchase or subscription.
Conversion Rate is calculated as the number of visitors who have made a target action (purchase, registration, a phone call) divided by the total number of visitors.
Overall conversion rate is not that meaningful as Dan Barker explains - it's essential to compare channels by conversion effectiveness and ROI.
Number of visitors who made a target action / Total number of visitors
Example 1
Let’s imagine you online store sells backpacks. During the day you had 678 visitors and 38 of them bought backpacks. In this case, the conversion will be 38*100 / 678=5.6%.
Conversion rate is easy to check if you have Google Analytics account — it is really great and convenient because in Google Analytics this metric could be related to different traffic sources and thus it will be easy to assess each channel effectiveness
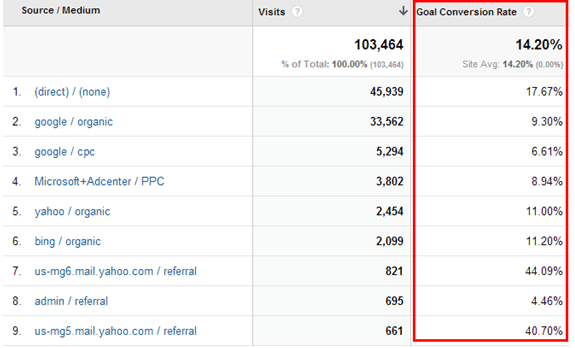
Please note that to be able to receive this kind of information you will have to have Ecommerce tracking setup or for non Ecommerce sites, previously set up goals in Google Analytics what you consider to be a goal (target action).
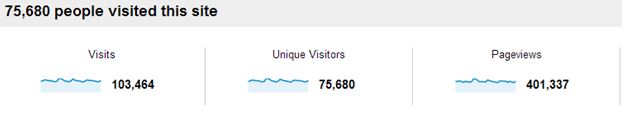
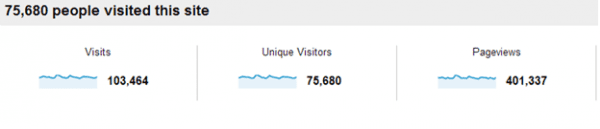
Another thing to remember is that Google Analytics calculates both unique visitors and visits in different reports and you need to understand that those are two different metrics.
Conversion Value indicates how much money we had to invest to receive 1 conversion (purchase, for example).
Example 2
Let’s get back to the backpacks and assume that we know the conversion rate for the website selling backpacks is 5.6%. The expenditures on promotion were $1,000 per month.
In this case, based on those 678 visitors 38 of which made purchases, the cost of attracting a new customers is 1000 / 30=$33.3.
Now let’s calculate the each conversion cost. We need to divide daily expenses by the number of conversions 33.3 / 38=$0.88 approximately. Now we know how much each conversion cost us.
The next step is to calculate profit from the sale. Backpack net cost is $18.75 and we sell it for $27.5, so the gross profit is $8.75 - $0.88=$7.87
If you are running any paid campaigns in Google AdWords or Facebook Ads or others to promote your products you can see the system do that job for you:

ROI (Return on Investment) is one of the key metrics for marketing specialists. It shows how effective were investments in marketing campaign.
Usually ROI is calculated as follows: ROI = (Revenue – Investment) / Investment
We recommend taking into consideration gross profit when calculating – this is the company's revenue minus cost of goods sold. It differs from operating profit, which takes into account the expenditures on salaries and earnings before interest and taxes are deducted.
Example 3
The online store profit from one backpack sold is $7.87 and the cost of attracting is $0.88.
ROI = $7.87 / $0.88 = $8.9*100 = 890% from one sale.
We’ve chosen the easiest example to illustrate the calculations. It is necessary to keep in mind that there could different types of backpacks and prices for them will differ as well, that is why the profitability will not be the same.
When applying these calculations, it is necessary to divide the marketing by activities or by traffic sources in order to clearly see which channel brings the highest return on your investment.
- 4. The average rate of closing a lead
The Average Lead Close Rate is used to assess the 'health' of a sales funnel. By performing monthly estimation you will be able to understand whether you get target traffic to a site and whether leads are handled properly by your sales team.
The index is calculated as ratio: New clients in the assessment month / Total number of leads in assessment month
For example, you received 3000 leads in June and those leads were converted into 25 clients. Let’s calculate:
25 clients / 3000 leads = 0.83%
Average lead close rate is 0.83%. If to turn the proportion upside down (3000 /25=120), we will find out that from 120 leads at the top of the sales funnel only 1 becomes you client. It depends on your business whether it’s a lot or not.
- 5. CAC (Customer Acquisition Cost)
For any business it is important to know the cost of a customer acquisition to understand when you should expect for the return on investment.
We recommend calculating CAC for every channel separately, to be able to clearly see the cost of customer acquisition for each of them.
The calculation could be made for any period of time: a month, a quarter, or a year.
CAC = Total expenditures on sales and marketing campaigns / Number of new clients
The calculations include sales department and marketing specialists’ salaries, bonuses along with marketing campaign and advertising expenses.
For example, let’s say in 2012 sales and marketing activities cost you $62,500 which brought you 1200 new clients. In this case customer acquisition cost will be the following.
CAC = $62,500 / 1200 = $52 — this is how much it cost you to attract one new customer.
This metric determines the number of months required to refund customer acquisition cost.
The calculations take into account the cost of customer acquisition (CAC), the average monthly income received from the customer and the average monthly cost of customer services.
CAC self-repayment period = CAC / monthly income – monthly expenses
For example:
CAC self-repayment period = $52 / (75 – 31.25) = 1.1 month
It means that in a month we will be able to get the return on our expenses for customer acquisition and customer service, and we will start receiving profit.
Ideally the repayment period should be less than 12 months. With longer repayment period you risk to lose the customer or you will have to make additional expenditures on retaining such customers.
- 7. Lifetime value: CAC (LTV:CAC)
Lifetime Value (LTV) is an indicator of profit a client brings after the first purchase is made and before he leaves.
- LTV:CAC – the client value for a company during the period of his interaction with the company.
- LTV:CAC = Life time value (LTV) / Customer Acquisition Cost (CAC)
This metric will show whether there are perspectives for your business to exist in the future. It is desirable that LTV: CAC exceeds 3X CAC.
Hope the indicators described above will help you understand whether marketing campaigns work for your online store and how essential their impact is. And what indicators do you use to analyze web store effectiveness?

Thank you to Elena Ruchko for her opinions and advice in her blog post. Elena is a GA certified individual and enthusiastic online marketer, who possesses experience in SEO and content marketing. Currently Elena works as a marketing assistant at
Promodo.com. You can connect with her via
LinkedIn,
Twitter or
Google+