Google has released the new Speed Report in Search Console – what is it, how do you use it, and what’s so great about it anyway?
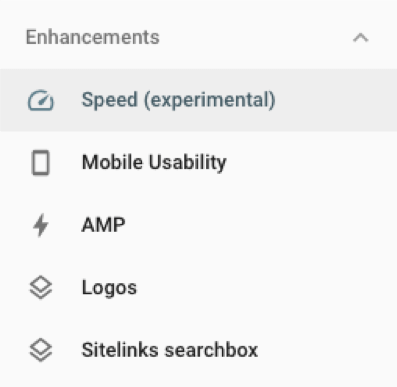
Following several screenshots teasing the release of the new Speed Report in Search Console, Google has finally released an ‘experimental’ beta version. The report enables users to assess the speed of their site’s URLs quickly and accurately. You can find it beneath the ‘enhancements’ tab:
The advantages of Search Console’s new Speed Report
Prior to the release of this report, speed testing was a troublesome task. SEOs and site owners have been reliant on third-party tools, masses of PageSpeed Insights tests, or complex Big Query requests to test page speeds. The new Speed Report improves on these tools in a number of ways.

Ease of use
One of the main perks of Search Console’s Speed Report is that it provides data on all of the URLs in one place. There’s no longer any need to submit multiple requests or run endless PageSpeed Insight tests. Speed Report assesses all of your URLs and gives you a graphical representation of how their loading speeds are changing over time.
Real-time data
Speed Report gets its data from the Chrome User Experience Report, which provides metrics to measure how real-world users are experiencing sites. As a result, the analysis in Speed Report is based on real-time user measurements rather than bot tests.
This kind of data was only available via Big Query requests or PageSpeed Insight tests in the past. As in the example below, it was fairly common for there to be insufficient field data to return results for URLs:
Testing this same URL in the new Search Console Speed Report, you can see that the data is now reported:
How to use the report
Now that we’ve looked at the fundamentals and advantages of the new report, it’s time to talk about how to actually use it. When you open the Speed Report, it’ll take you to a dashboard that helpfully breaks down how your URLs are loading on desktop and mobile:
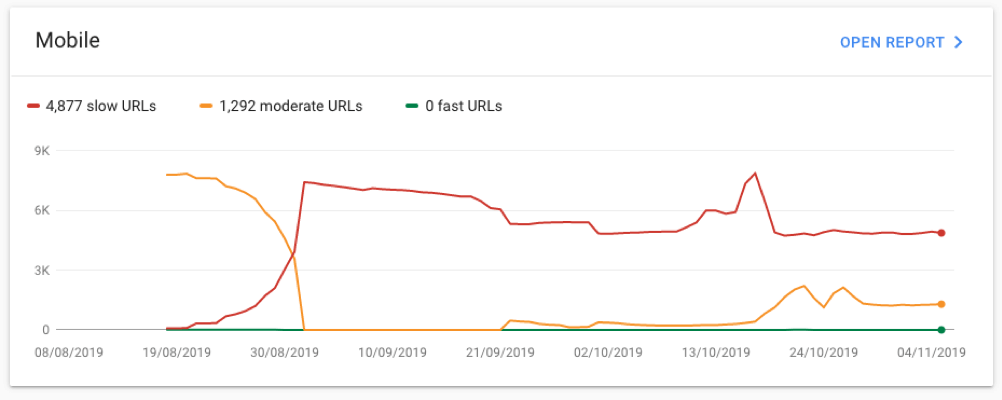
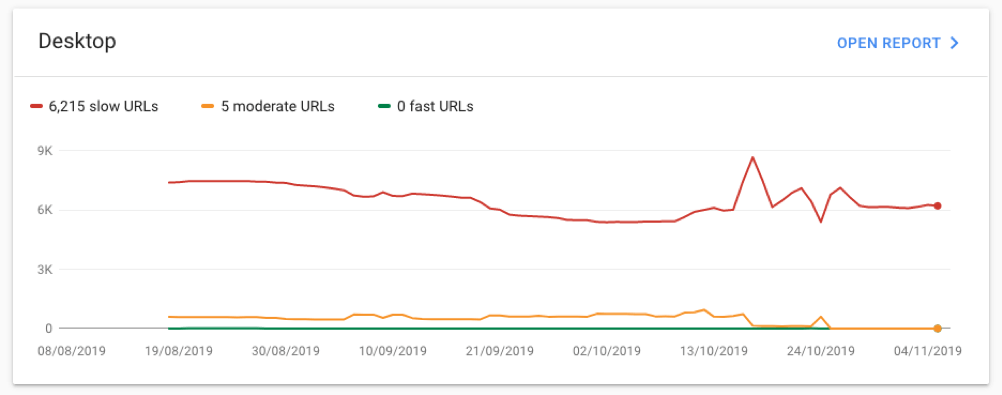
The first point for you to note about this dashboard is that there’s no section for tablets. At this stage, we don’t know if tablets have been included in either the mobile or desktop report – it’s possible that this will change as Speed Report develops beyond its experimental phase.
As you’ve probably noticed already, these reports use a traffic light system to show you pages with slow (red), moderate (yellow), or fast (green) load speeds.
Opening up the reports
Clicking on either the mobile or desktop report will open up a new dashboard that looks like this:
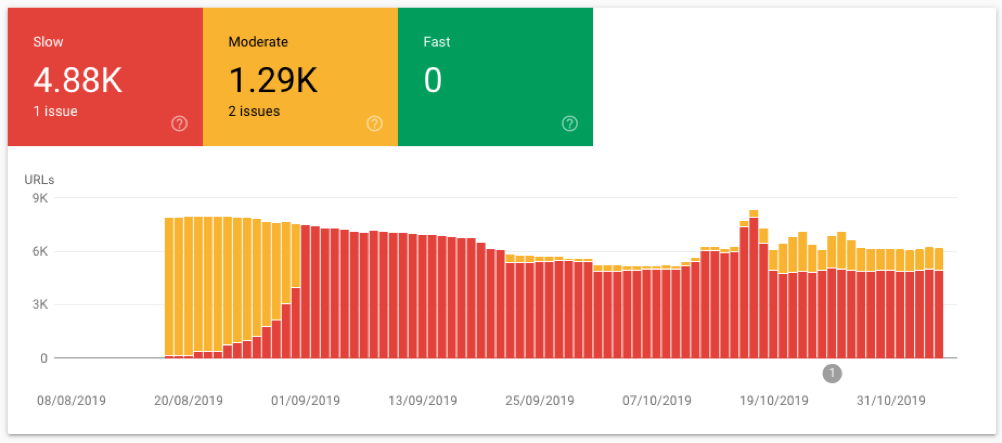
As with the other Search Console interfaces, this graph can be filtered to display the number of slow, moderate, or fast URLs as they change over time. This is pretty useful because it highlights areas for you to focus on. In the above example, we’d want to look into what happened at the beginning of September and ask why so many URLs suddenly became classed as slow at this stage.
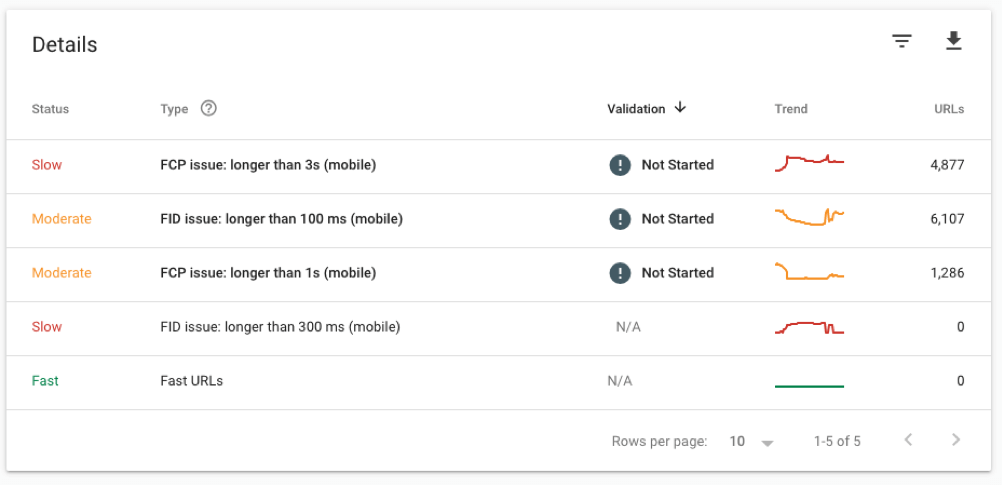
Below this interactive graph, you’ll find a ‘details’ section that explains different types of page speed-related issue:
What are FCP and FID?
In order to understand the ‘details’ section, you’re going to need a little bit of knowledge about different page speed metrics. At this moment in time, Google is only using two metrics in the Search Console Speed Report:
- First Contentful Paint (FCP) refers to the length of time that it takes to load the first content on a given page. The longer a page’s FCP, the higher the likelihood that they’ll bounce before even taking a look.
- First Input Delay (FID) refers to the time that elapses between someone clicking on a site element and the browser reacting to it. Long FID times make a page seem laggy and unresponsive, potentially frustrating users.
The classification brackets
Pages are classified as slow, moderate, or fast based on these two metrics. For FCP measurements, the following brackets apply:
- Pages with an FCP under one second are deemed ‘fast’
- Pages with an FCP between one and three seconds are deemed ‘moderate’
- Pages with an FCP above three seconds are deemed ‘slow’.
For FID measurements, much faster times are expected:
- Pages with an FID under 0.1 seconds are deemed ‘fast’
- Pages with an FID between 0.1 and 0.3 seconds are deemed ‘moderate’
- Pages with an FID above 0.3 seconds are deemed ‘slow’.
It’s worth noting that these classification brackets are the same for the desktop and mobile reports. One common criticism of the new Speed Report is that the speed expectations are too harsh, although we know that Google consistently sets high standards.
Analyzing issues
So, you’ve found the page speed-related issues in the mobile and desktop reports under ‘details’. The next stage is to click into individual issues to find out more.
This will open up a graph that shows you how the number of URLs affected by that particular issue has changed over time:
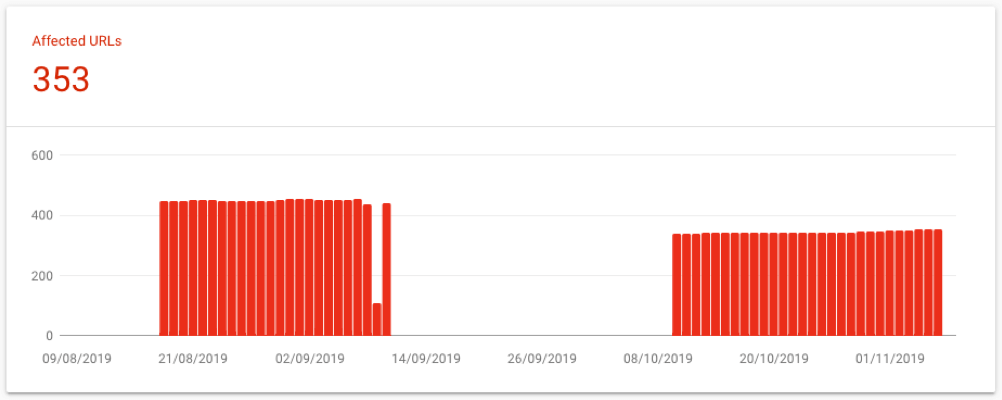
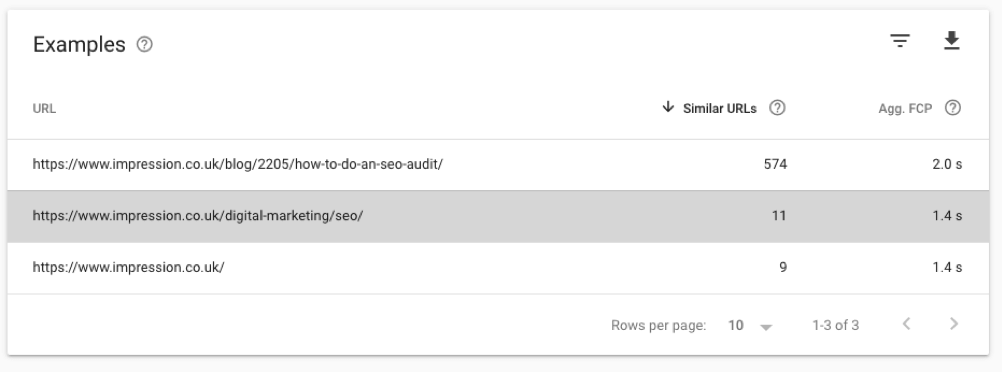
Below this, you’ll find a further section that helpfully supplies examples of URLs affected by this issue and gives you the current total number of ‘similar URLs’ that are also affected. Here’s an example from the Impression site, highlighting examples of URLs with a moderate FCP.
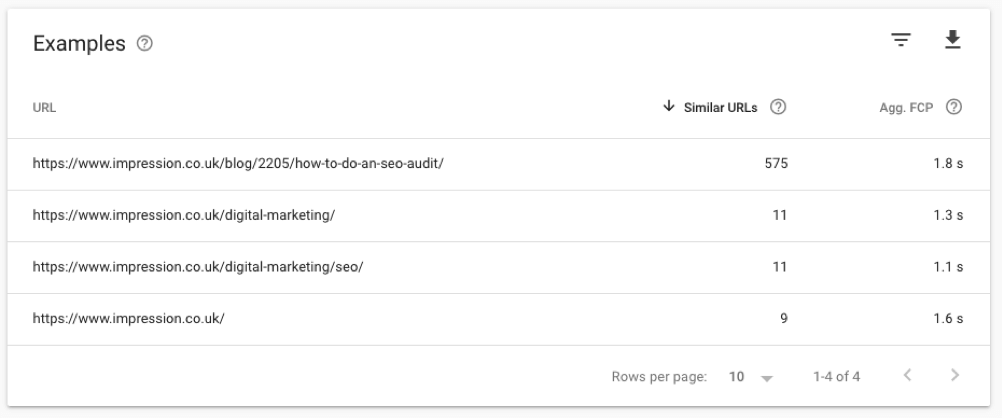
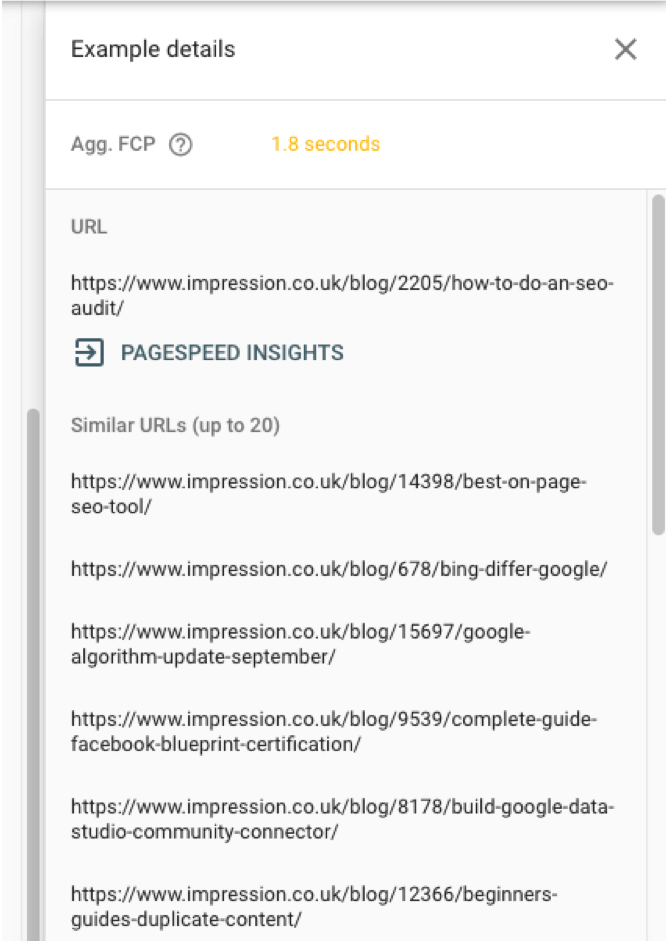
Clicking on a URL will bring up a selection of these similar URLs. This is one of the drawbacks of the report, in that only a handful of similar URLs will be displayed. You can see this in action in the following screenshot, which shows that just 20 similar URLs are provided despite the fact that there are 575 in total:
In this case, the similar URLs section is still useful because it highlights the fact that the blog on Impression’s site contains many URLs affected by the moderate FCP issue. It’s also possible that you’ll be able to view more similar URLs in the future.
What next?
Once you’ve identified groups of URLs with slow page speeds, it’s time to do something about them! Although you may have your own process in place for this part, it might be worth taking you through this step by step.
Consulting the PageSpeed Insights tool
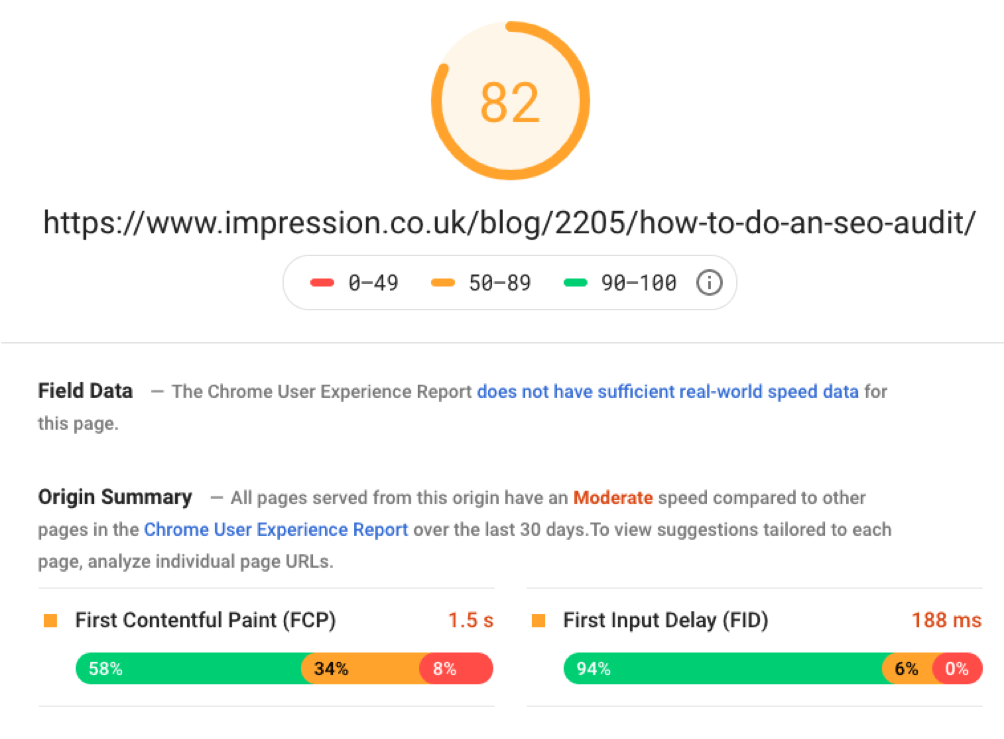
For each URL listed in the Search Console Speed Report, you’re given the option to load it up in PageSpeed Insights. When you do this, you’ll probably find that the results are different from the real-time measurements provided by the new report.
The following URL was found to have a moderate FCP of 1.8 seconds in Search Console, yet returns a strongly positive score of 98 with an FCP of 1.5 seconds in PageSpeed Insights:
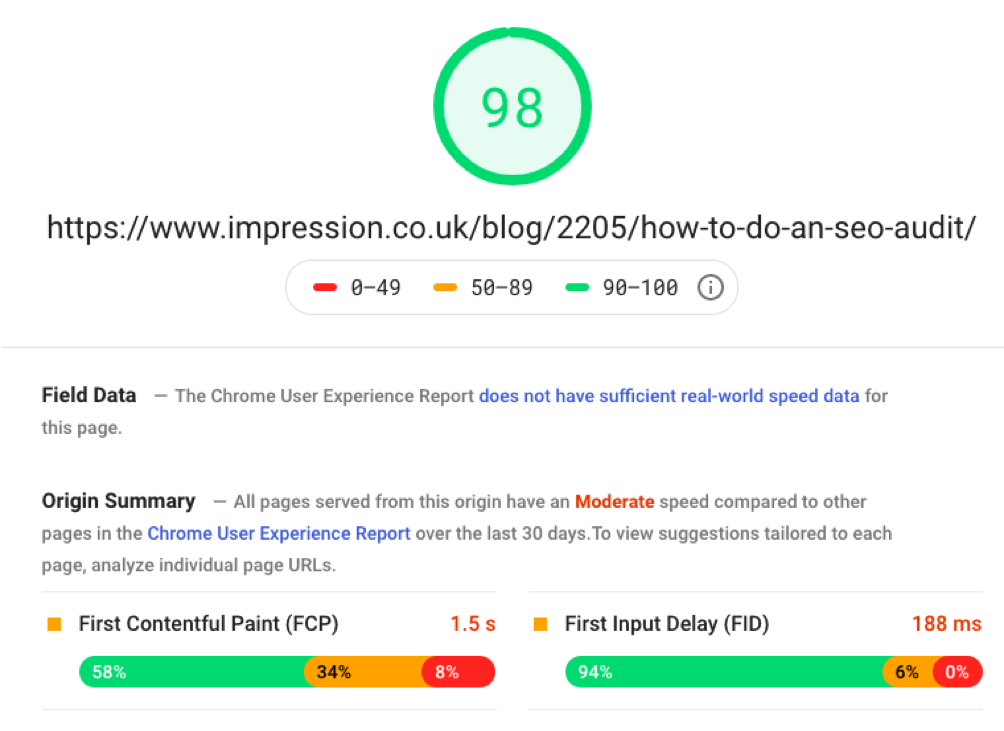
Nevertheless, PageSpeed Insights is still a valuable tool because it provides recommendations for how to increase the speed of pages on your site. For the URL above, the tool suggested that images could be compressed further and offscreen images could be deferred.
Make changes and observe the effects
Okay, so you’ve got a list of fixes that could improve the speed of your pages. At this point, you or your development team should implement them and see if they have any effect.
Before returning to Search Console, you should rerun the PageSpeed Insights test on the affected URLs to see if the fixes have worked. Having confirmed that the affected pages are now loading faster, you can return to the Speed Report to validate your fixes.
To do this, simply return to the report in question and click ‘Validate Fix’:
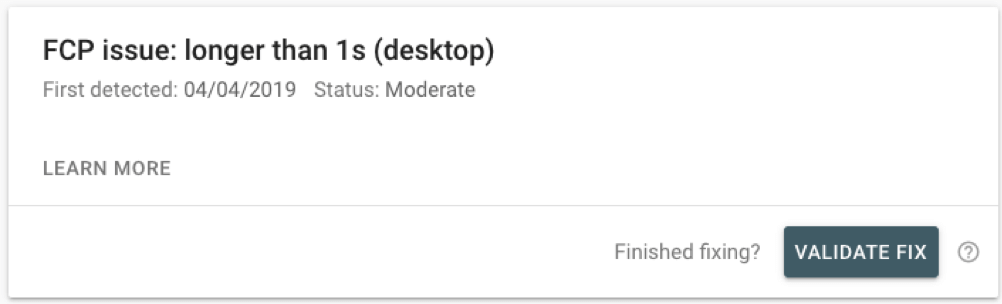
This opens a ‘verification window’, during which time all visits to the affected URLs will be monitored by Google. For larger sites, this should take 28 days; if your site gets less traffic, it could take a little longer.
You’ll need to repeat these steps for all of the issues identified by Search Console’s Speed Report.
Summary
This guide should have given you all of the information that you need about the new Speed Report in Search Console, explaining what it is, the advantages, and how to use it. The most important points are summarized below:
- Compared to existing tools, the main advantages of the Speed Report are that it provides real-time data with greater accuracy and immediately analyses all of the URLs on a site.
- This report isn’t a replacement for tools like PageSpeed Insights – it should be used in tandem with them.
- The Speed Report has its limitations. For example, when looking at similar URLs that are affected by the same speed-related issue, only a handful will be displayed.
- Given that the report is still in the experimental phase, Google may make changes to it going forward.
Charlie Norledge is a Senior Technical SEO Specialist at
Impression. He has a passion for web performance, structured data, log file analysis and all other things that clients can throw at him. When he’s not focusing on these you can find him speaking at industry events such as BrightonSEO.