Chart of the Week: 87% of business video views take place on desktop but what types of videos are people engaging with?
Video marketing is highly engaging and increasing in popularity, especially with the ability to share and view them via social media platforms. In fact, people are more likely to choose video over other forms of content, with 72% of people saying they’d rather use video to learn about a product or service if it is on a page alongside text.
As well as being engaging, video can also help influence decisions in both B2B and B2C industries. Research from Wyzowl reveals that 79% of people have been convinced to buy a piece of software or an app by watching a video.
Download our Individual Member Resource – Video and YouTube marketing guide
Our guide shows you how to review the full opportunities from video marketing whether you are a company looking to integrate video marketing more into your campaigns or a marketing agency looking to improve your video marketing services.
Access the Video and YouTube marketing guide
With so many benefits to be gained from video – both in terms of brand awareness and conversion – it pays to understand the trends around this form or marketing content. Vidyard’s 2019 Video in Business Benchmark Report includes a number of interesting B2B findings, which we will explore below.
Desktop is still king
Although social media means that it is easier to watch videos on the go on mobile devices, the majority of people are still viewing B2B videos on desktop. Some 87% of business-related videos views still take place on desktops or laptops.
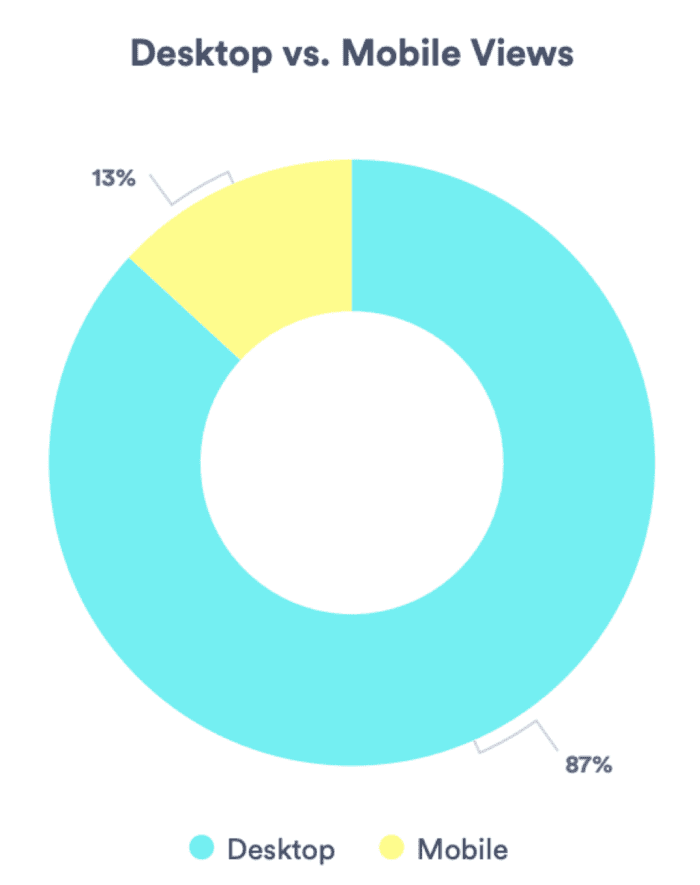
Although there has been a 25% year-on-year increase in mobile video views, mobile still only accounts for 13% of total business video views. This is likely due to the fact that the majority of B2B videos will be watched during work hours, meaning they are more likely to be viewed on desktop devices.
This suggests that while you do want to consider mobile when creating B2B videos, your primary concern should be the desktop viewing experience.
Optimize for Chrome
In terms of the browser most people use when watching videos, Chrome is in the top spot. Almost two-thirds (61%) use this browser for watching videos, followed by Internet Explorer with just 15%. Other browsers used include Safari (10%) and Firefox (7%).
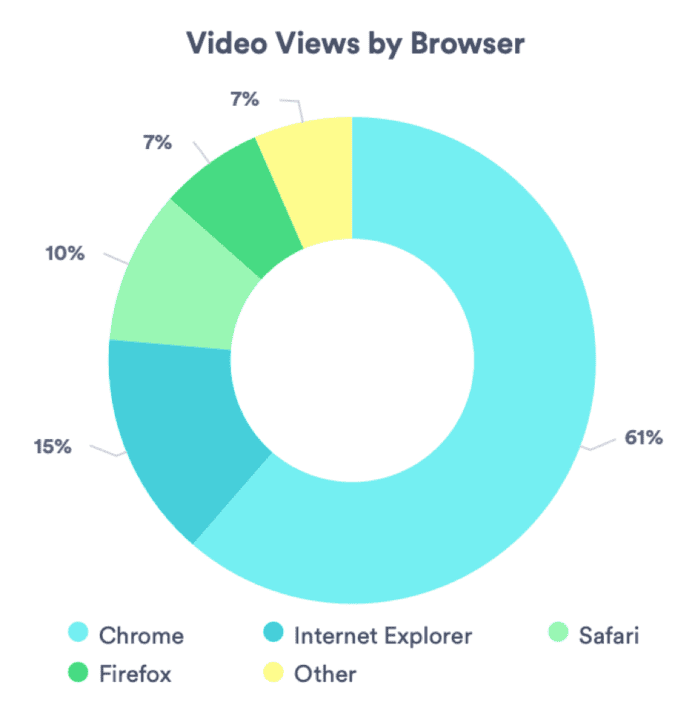
Although it is ideal to ensure that videos are viewable via all browsers, the huge number of individuals using Chrome means that it is best to optimize them for this browser in particular. However, looking at options that allow videos to be played across all or most browsers is always going to ensure the best possible user experience.
Thursdays see the most views
Weekdays are more popular for B2B video views than weekends, which ties in with people watching them while at work. However, Thursdays seem to be the biggest day of the week for videos with 22% of views happening on this day.
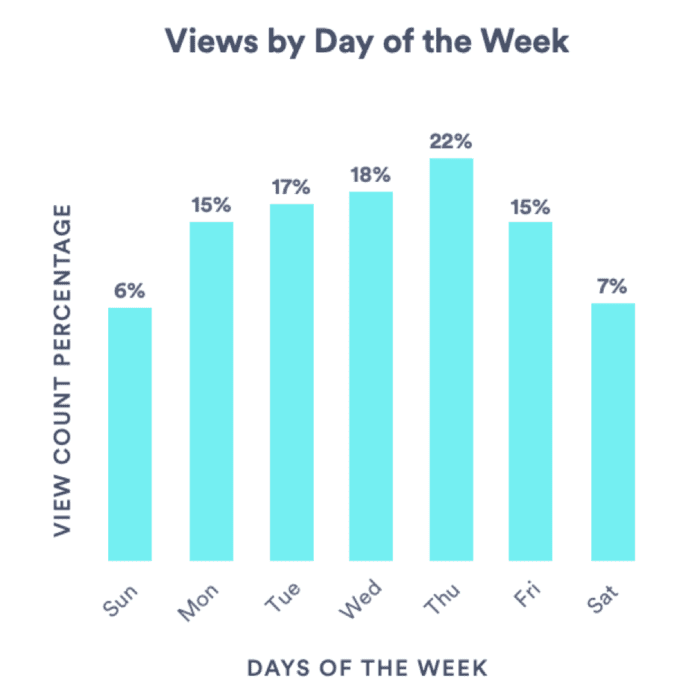
Following Thursdays is Wednesdays, with 18% of views and then Tuesdays with 17%. Mondays and Fridays both see 15% of views while Saturday (7%) and Sundays (6%) are lower on the list.
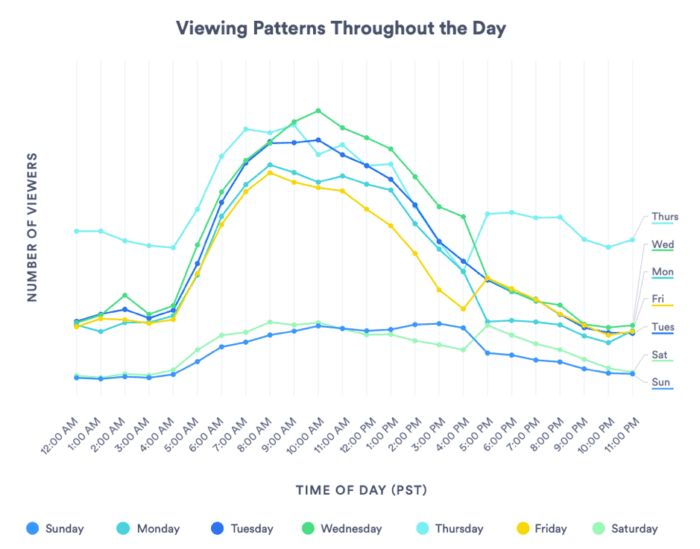
In terms of the best times for video views, mornings tend to see the most during the week. The peak mid-week is between 9am and 11am PST, with this peak starting an hour earlier on both Mondays and Fridays.
These times could also coincide with the best times for emails to be opened, so if you are including videos in your emails, it may be best to send during these windows in order to optimize open and video view rates.
High tech industries create the most videos
Many different industries are now using videos throughout their marketing for a variety of reasons. The research found that the industry that creates the most videos is High Tech, which sees an average of 425 videos created by companies in this industry.
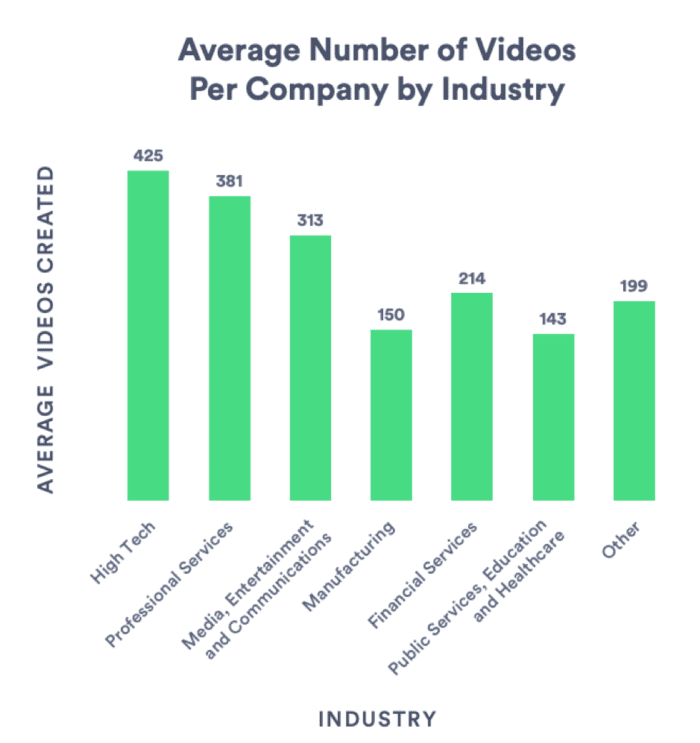
Professional Services companies also create a good number of videos on average, coming in at 381, following by Media, entertainment and Communications businesses at 313. Public Services, Education and Healthcare don’t create as many videos per company as other industries, which may be due to the nature of the information they are providing.
Larger companies produce more videos
Unsurprisingly, it is larger companies that tend to produce the most videos. Businesses with more than 5,000 employees produce around 538 videos, which is likely due to the fact that they have both more budget and resource. These companies are also more likely to have more departments to make use of this content format.
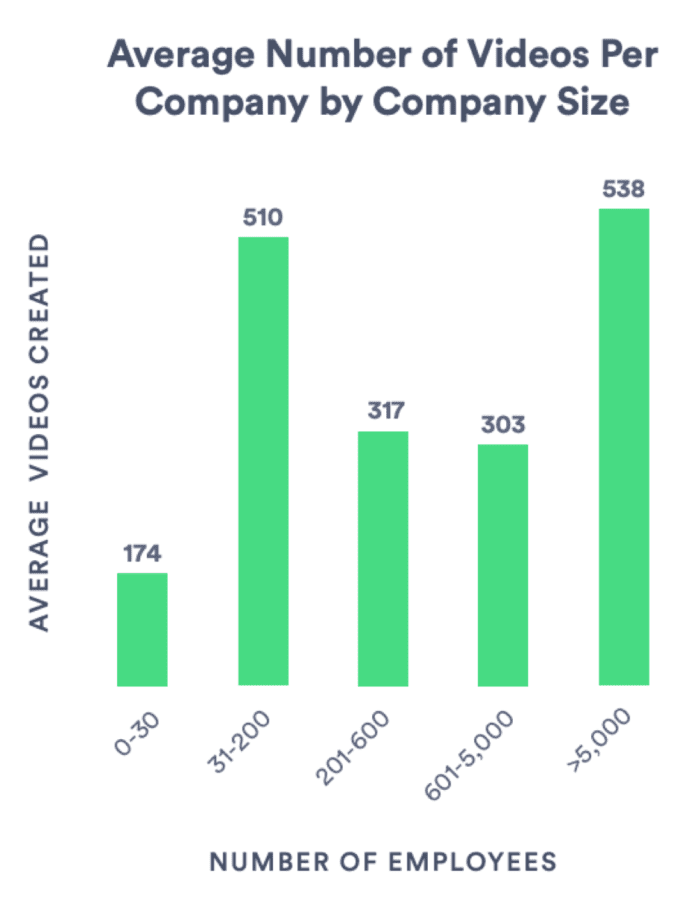
While you might expect the next largest companies to create the second most videos, this isn’t the case. According to the report, businesses with between 31 and 200 employees create the second most videos at 510, on average.
This suggests that smaller companies are making use of free or cheap video tools in order to create content and compete with larger firms. This result could also be largely influenced by social media, which is a popular way for startups and smaller companies to increase awareness and engagement. Social media allows companies to make use of live videos and Stories, both of which can be cheap to produce.
October sees most videos published
When looking at the number of videos published across the year, October is the busiest month. Around 13% of all business videos are published in this month, representing an 11% year-on-year increase.
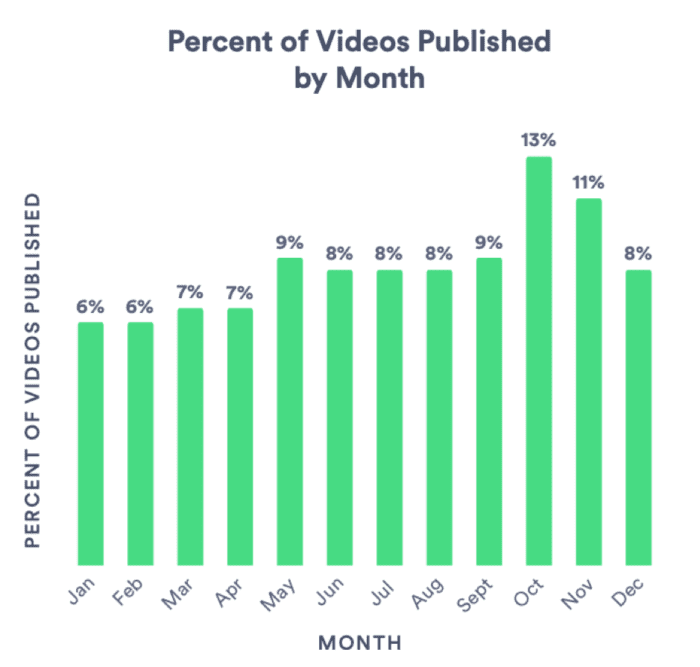
In fact, the end of the year saw the most videos created, with 11% of the year’s videos being created in November. December was a bit quieter, likely due to a number of businesses not operating or reducing output over the Christmas period.
This increase in videos suggests that they are being created as promotional materials ahead of the busy festive period. A large number of conferences also take place at this point in the year, which could mean that businesses are creating videos as part of their promotion for events.
More companies are using internal resources to create videos
The vast majority of companies now use internal resources to create videos, with small companies more likely to do so. A total of 48% of companies with annual revenue of less than $25 million now use internal resources for video production, showing that it is now much easier to find tools that allow you to create videos.
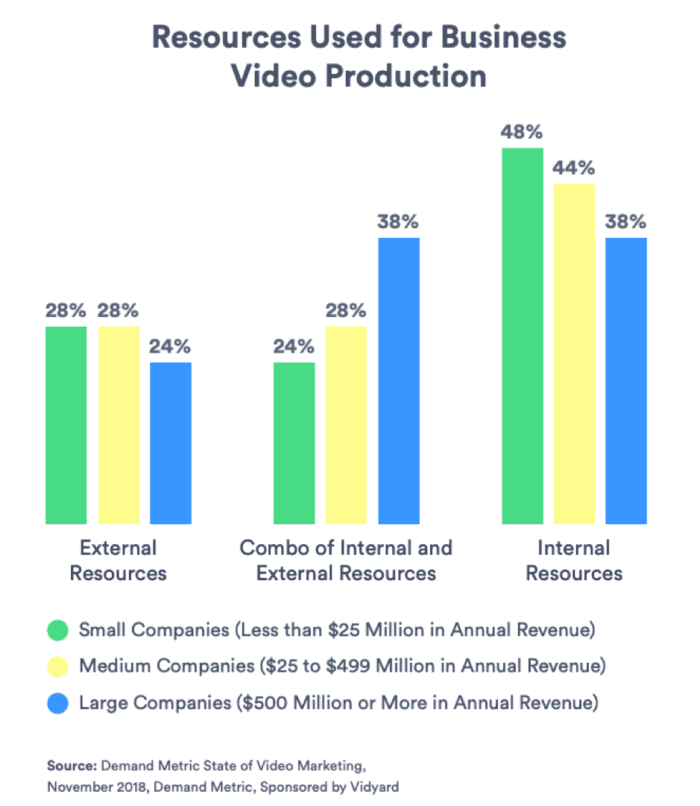
Large companies are equally using internal resources and a combination of both internal and external resources. Comparatively, less than a quarter (24%) are using external resources, suggesting that more companies are investing in technology and employees to create video content.
Webinars are most popular form of business video content
According to InsideSales, 73% of marketing and sales leaders say that webinars are the best way to generate leads. This perhaps explains why 56% of businesses have already invested in webinars as a video type.
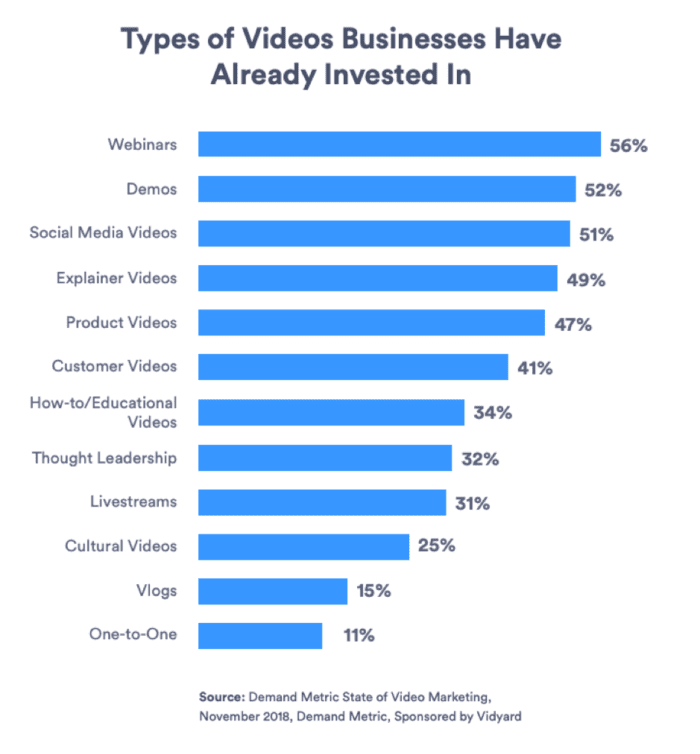
Over half of respondents have also invested in demos (52%) and social media videos (51%). This suggests that businesses are making use of videos throughout the customer journey, showing that they are powerful tools in terms of increasing conversions.
Despite the ease of creating live videos, less than a third (31%) of businesses have invested in this video type. The low-cost nature of live videos makes them appealing but the inability to edit the content is likely off-putting for companies. However, with so few businesses going live, this could represent a good opportunity.
Websites and social media key for distribution
Unsurprisingly, most businesses are distributing their videos either on their websites (85%) or via social media (84%). Over half (55%) use them in emails and 67% of businesses are making use of YouTube for video distribution.
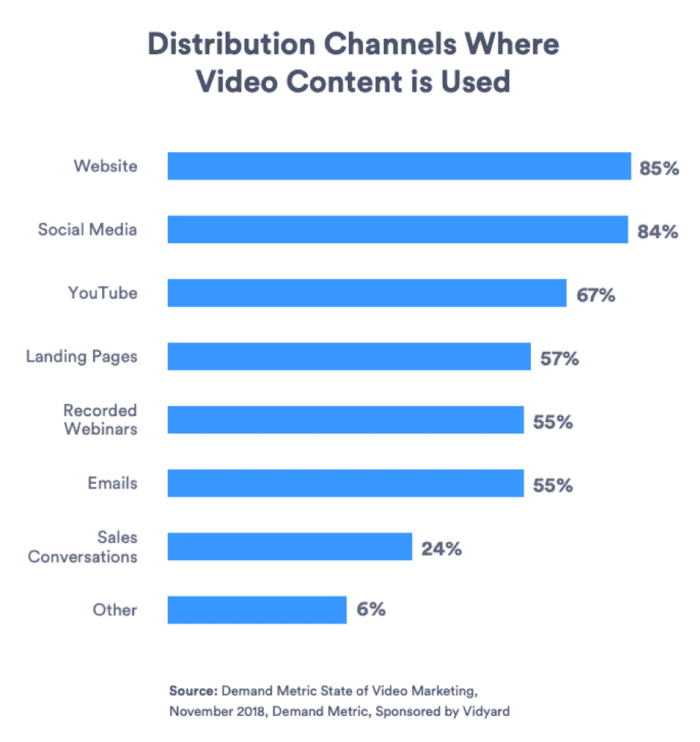
The nature of videos means that they can be distributed via a variety of channels in order to reach different audiences. Using the same videos in as many different ways as possible is likely to provide higher ROI and engage more people. As a result, videos can help see overall engagement across digital channels increase, which is a top priority for almost a quarter (24%) of marketers.
Video length impacts overall engagement
Shorter videos are more likely to keep watchers engaged right until to the end, mirroring the reduction in overall attention spans being seen by marketers. If a video is less than 60 seconds, over two-thirds (68%) of viewers will keep watching until the end. In comparison, if a video is over 20 minutes long, only 25% of viewers will finish it.
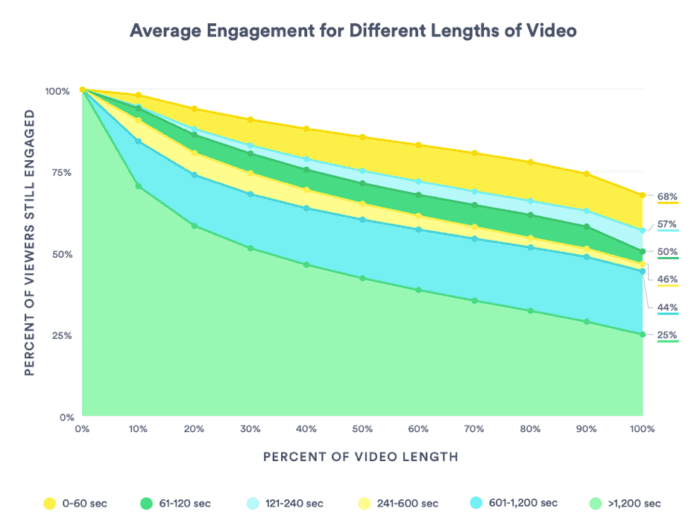
The average engagement rate across all videos is 52%, however, this improves for different length videos. Overall, videos that are between two and four minutes long perform best and will have more people watch to the end than those that are between one and two minutes.
This is likely due to the content of the videos, with slightly longer videos being more in-depth. However, going over the four-minute mark will see a greater drop-off, so this should be used as the maximum video length for best performance.
Final thoughts
Increasing video use shows that it is a content form worth investing in if you want to keep up with your competitors.
While businesses are seeing good results from some video types – such as webinar – it is worth bearing in mind the fact that the market could become oversaturated with this video type. Looking at what videos you can create that others in your industry aren’t could help you engage your audience on a different level.
Most importantly, whatever type of video you create and how you create them – in-house or externally – the most important factor to consider is length. Keep videos between two and four minutes long to ensure you get enough information in without causing your audience to lose interest.