Discover how AWA digital defied "best practice" to drive up conversion rates for a global car rental company
Discover Cars, a fast-growing car rental comparison and booking site, came to conversion rate optimization (CRO) agency AWA digital for help with increasing the profitability of their website.
To Discover Cars, "profitability" meant an increase to both conversion rates and average revenue per session (RPS). Car rental sales are always important, but most of the RPS boost came from their highly profitable upsells, so maximizing uptake of these was key to getting the best ROI. Using their proven methodology, AWA started the deep research that defines its process before creating a roadmap of hypotheses and split tests.
Website conversion optimization planner
Stop losing valuable leads and sales. Use our website conversion optimization planner to map out your next project and ensure you're getting the most of our your site pages.
Access the Website conversion optimization planner
The typical user journey through the Discover Cars site was similar to most other car rental companies:
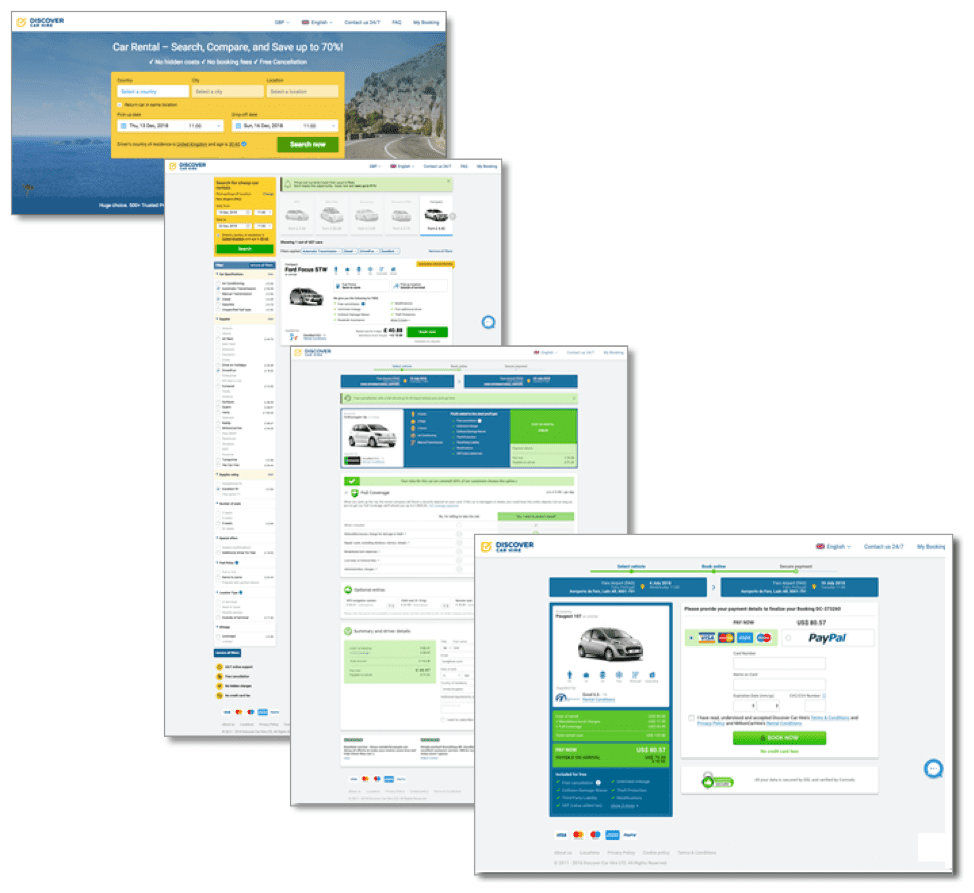
- Home/landing page to enter search criteria (dates/location etc.)
- Car results page
- Car detail page for the chosen vehicle, where users can select their extras, insurance options and start the booking process by entering personal information
- Payment page to complete the booking and pay a deposit
AWA prioritizes opportunities likely to have the biggest impact in the shortest time frame. Step three, the car detail page, saw the biggest drop-off rate, so it became a focus area in the funnel.
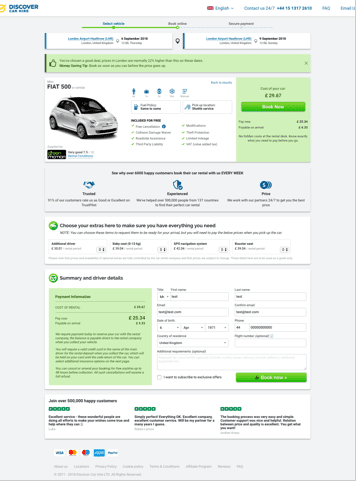
This is where a user lands after browsing all the available cars and making a selection; it was a long page with four sections:
- Full details on the chosen car and rental provider
- Optional extras (such as child seats, GPS)
- Insurance excess (an upsell that protects your excess deposit - this is the most profitable option)
- Summary of the price and a form for the driver details, which starts the booking process
Data and customer insights
As standard, AWA uses up to 32 different research techniques to get the level of insight required to make the big testing decisions. With Discover Cars, that included:
- Over 500,000 Google Analytics visitor records analyzed
- Heat/click maps for 25,001 website visitors
- 6,480 pop-up survey answers analyzed
- 19,784 surveys sent to the customer base
- 891 surveys completed by existing customers
- 61 surveys completed by funnel drop-out customers
- 856 exit surveys completed by new customers
At first glance, this Crazy Egg click map of the 'car detail' page tells a good story:
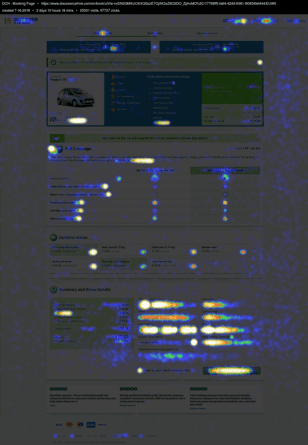
Most activity is happening exactly where Discover would want it – in the form fields where customers input their personal details to start the booking process and on key areas of the upsells section as well.
However, the scroll map adds insightful nuance to that initial observation:
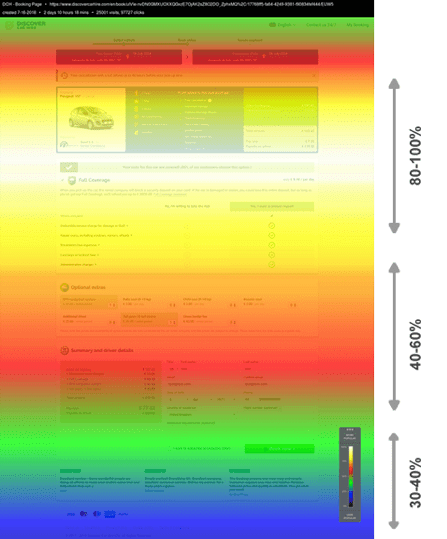
The white and yellow are the peak spots viewed, unsurprisingly at the bottom of the main fold. The upsells sections (insurance and extras) gets solid views as well, but the map is already turning red by the time users hit the 'extras' and has gone green by the time we reach the form at the bottom. That means less than 50% of users reach the section of the page that contains the big profit boosters – effectively cutting conversion potential in half.
It also shows that the testimonials right at the bottom of the page are in blue – only 30% of users are seeing the key 'trust element' on the page.
What the survey results were telling us
The most powerful insights, however, came from qualitative research, in particular, user surveys. AWA put together exit surveys, live on-page surveys using Qualaroo and email surveys that were sent both to recent customers and those who had started but dropped out of the final booking phase.
The main feedback picked out four major issues that customers had when going to book their car:
- Trust – By far the biggest issue as Discover Cars is a relatively new, unknown brand in an industry plagued by cowboys outside of the well-known brands.
- Insurance – Many customers were confused by the insurance options. What was required? What was optional? What are the exact terms of that coverage?
- Payment Process – Customers were confused about when they needed to pay money and whether it was to Discover Cars or onsite at the rental firm or both.
- Cognitive Fluency – This refers to the extent to which a purchase decision can be made virtually on auto-pilot. Here there were lots of options (and many potential distractions) that were causing users to pause and think.
Test hypothesis
The data from the scroll maps suggested that the page was too long before getting to the CTA.
Not only were the optional extras out of sight for many users, but the user surveys also suggested that they were confused, and therefore wary, of the insurance options. Having the extra space to explain it in more detail could relieve that anxiety.
AWA, therefore, wanted to simplify the page and use more human language throughout to make it sound more friendly, trustworthy and persuasive. One way of doing this was by breaking the content up across two pages.
Control vs. variation
Control: The long, single page with all the booking information in one place - along with the optional extras and the key insurance upsell.
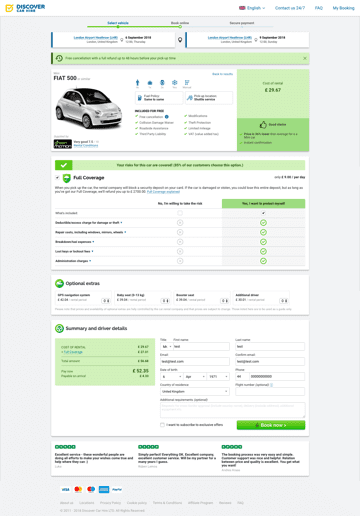
[Control]
Variation: By splitting the booking page into two separate areas we can have a greater focus on each of the two core conversion elements (booking form completion and full coverage) without them fighting for attention on the same page.
[Page One]
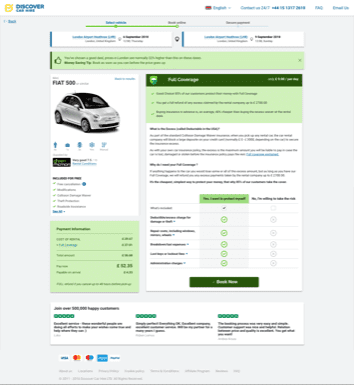
[Page Two]
Testing technology
The testing platform was VWO. AWA is the only Premium Partner of VWO in the UK and South Africa. By using a combination of VWO to monitor test results and long-term output, AWA was able to track key metrics such as conversion rate, revenue per visitor, and average order value. It is standard practice to also integrate the testing platform with Google Analytics for deeper and segmented post-test analysis.
VWO’s SmartStats engine was used to determine the outcome. This model uses Bayesian statistical confidence algorithms, which can arrive at a statistically robust result and sound business decision in a reasonable time frame.
Outcome
AWA achieved strong results with this campaign:
- Control: 64% CR
- Variation: 88% CR
- Conversion rate uplift: 7%
- Revenue uplift during test period: 2%
- Probability: 98%
Long-term results
This test was part of a series that was conducted over a period of several months to drive the site ROI during the busy Summer period. Over that time, overall conversion rates were increased by 26.7% and revenue increased by 11.76%.
Meaning that within just a few months, a CRO project increased its annual revenue and profits by nearly 12% and decreased the CPA on its ad spend with aggregators and paid search by over 25%.
Conclusion
While best practice guidelines can be useful, this test shows that it pays to be brave and listen more closely to your customers. Not all websites, products, journeys, audiences and buying decisions are the same and to treat them all as 'average will only ever lead to vanilla experiences - and very average conversion rates.
Sometimes, like with this insurance offer from Discover Cars, an offer that makes complete sense to you can be confusing for your customers. Use the data available to you to see if there are problems, such as increased drop-out rates, longer dwell time or clicks away from that page that may suggest your customers are trying to find answers to their questions.
Once you have found the problem, try and fix it. Again, there is no golden-bullet answer here. But remember what you are trying to do: make it easy for your customers to buy, not try to sell to them (a subtle difference, maybe, but a crucial one).
It may be that you need to use different words that aren’t brainstormed by marketers but are inspired by the language your customers use. Or it may be that you need more copy, more room to explain what it is you’re offering and how it benefits them.
The rule of thumb, we’re told, is to always use less copy, fewer pages, fewer clicks. But, as this test proves, you actually just need to do what is right for each individual sales conversation, each product, each purchasing decision and each audience persona. Only then will you be able to guarantee results.
Conversion Rate Optimisation – or CRO – may seem like a dark art if you’ve never experienced it first-hand. E-commerce companies who embrace CRO claim to get stellar results and ever-increasing online sales. If you’d like to replicate their achievements, contact AWA Digital to see how CRO could help your business. We’ve also created an infographic that gives an overview of all the key elements involved in successful CRO, designed like the well-known periodic table for chemical elements.
Thanks to Phil Cave for sharing their advice and opinion in this post. Phil is a senior optimizer at
AWA digital, with over 20 years of experience in using neuromarketing and data to increase online revenue for a wide range of businesses. His methodologies and approach have delivered significant wins and over £1Bn in additional revenue for his clients.