What percentage of searches are on organic vs paid results
Much of the insight into how consumers search is based on Google services like Keyword Planner and Search Console. Like all analytics, these are limited to quantitative data and don’t tell us much about the motivations for the behaviour.
This research study considers different types of behaviour by reviewing eye-tracking for different search types on the ‘path to purchase’. It’s a UK study, similar to previous research from iProspect in the US that I reported on, but haven’t been repeated recently.
How to conduct keyword analysis in Google Search Console
Utilize Google Search Console to carry out intent-driven keyword research analysis and find SEO opportunities. This Quick Win is perfect for anyone unfamiliar with Google Search Console or looking to refresh their knowledge of the platform.
Access the quick win
Update: At the end of this post, I've added complementary, more recent research from Rand Fishkin of SparkToro which provides US data comparing the organic vs paid ratio for mobile and desktop.
Methodology
Eye tracking was used to observe respondents when searching with Google using a variety of commonly used search terms across eight sectors: Male and Female Fashion, Beauty, Home Furniture and Furnishings, Health, Dental, Hotels and Holidays, Insurance and Restaurants.
Each search term was introduced to the respondents with a research task, based on a context. For example:
‘You’ve started planning your next family holiday and you’d like to go all-inclusive. Having children, you find this type of holiday suits you all really well. Please use the search term “all inclusive family holidays” to find a holiday to suit your needs.’
Each respondent was tasked with carrying out six (on desktop) or seven such searches (on mobile), all tailored to their gender, age and life stage. Here is an example of the eye tracking for two different types of behaviour.
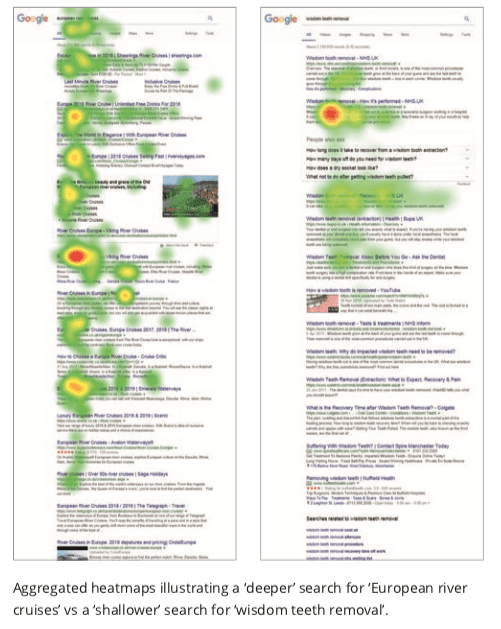
A common scrolling behaviour was observed in the research on both desktop and mobile devices. Overall, 70% of the desktop and mobile searches involved some kind of scrolling (down or down and then up), usually towards the middle or even the bottom of the page. In over half of the ‘scrolling’ situations, respondents scrolled back up - usually towards a search result they had already spotted.
“I always have an idea of which shops I’d like to shop in any way, but I kind of like to quickly scan more of the results [before going to the known brand].”
Female Pre-family respondent
In the eye-tracking example above, the first aggregated heatmap shows how respondents absorbed more information in their search for ‘European river cruises’. Skimming through the PPC ads, a Featured Snippet and a significant part of the organic listings showed that the search for a cruise holiday tends to involve more time spent on the Google SERP.
The second example illustrates a shallower search, with respondents’ attention concentrating towards the top results of their dental informational search. The presence of the trusted brand – NHS – just at the top of the page was, for some respondents, a reason not to explore the other results further.
Preferences for organic vs paid results
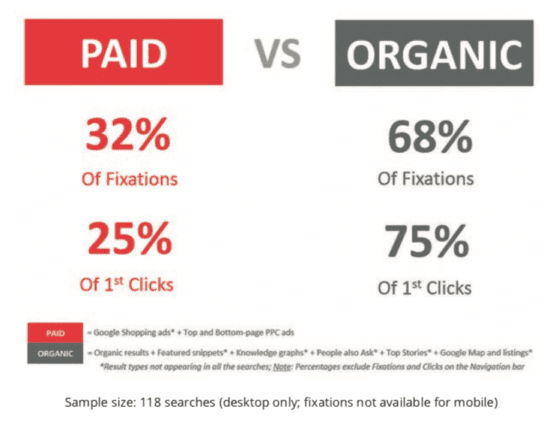
I find when training, that often people’s personal behaviour prejudices their views on the popularity of paid results. This research shows that although the organic results are most popular, the paid results are significant.
The ‘rule of thumb’ of search results popularity is that ‘organic’ results account for about two-thirds of attention fixations and 75% of first clicks on desktop.
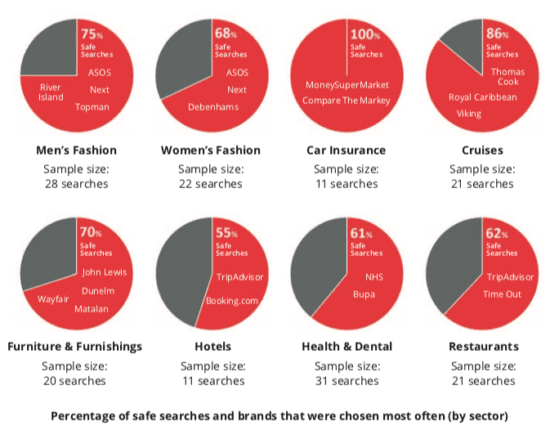
The research has many other insights about search behaviour, some surprising, some less surprising. For example, the importance of brand familiarity was clearly shown by the participants across sectors like retail, travel and financial services. When searching using a generic search term between two-thirds and three-quarters selected familiar, expected brand names from the SERPs:
Research source
New research update
This SparkToro research reviews Google CTR: Paid, Organic, & No-Click Searches.
This shows that the ratio of paid to natural search is:
- Desktop: 66.5% organic, 3.9%, paid, no click 33.5%
- Mobile: 38.2% organic, 3.4% paid, no click 63.8%
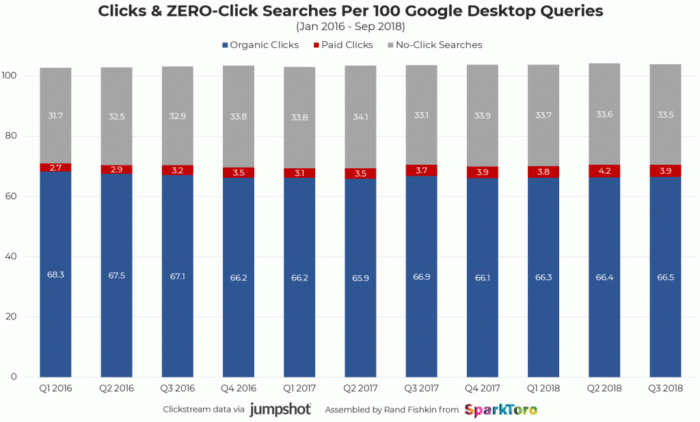
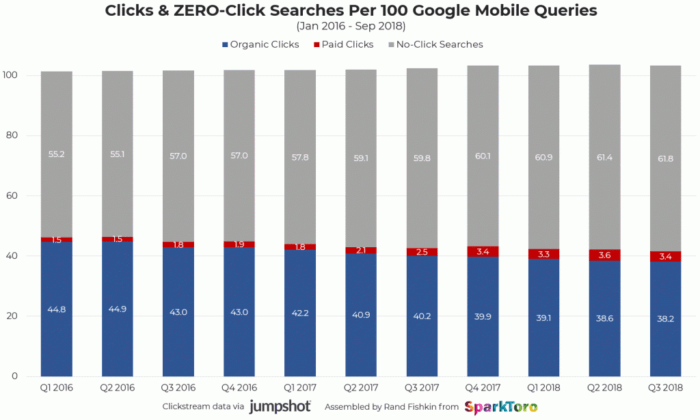
In the last two and a half years, mobile “no-click” (or “zero click”) searches have grown 11%. Desktop no-click searches have grown 9.5%. This is highly significant for search strategy, since it suggests the growing prominence of Google features like rich snippets and related answers have reduced Clickthrough rate making it more difficult to gain visits, leads and sales from search marketing.


