Build your own CrUX dashboard on Google Data Studio to see visual stats on origin performance
After the latest announcement of changes to Google Ads, the introduction of responsive ads, better video and YouTube advertising, cross-device reporting functionality, and the lastest broad-core Google algorithm update, it seems Google has had a busy quarter.
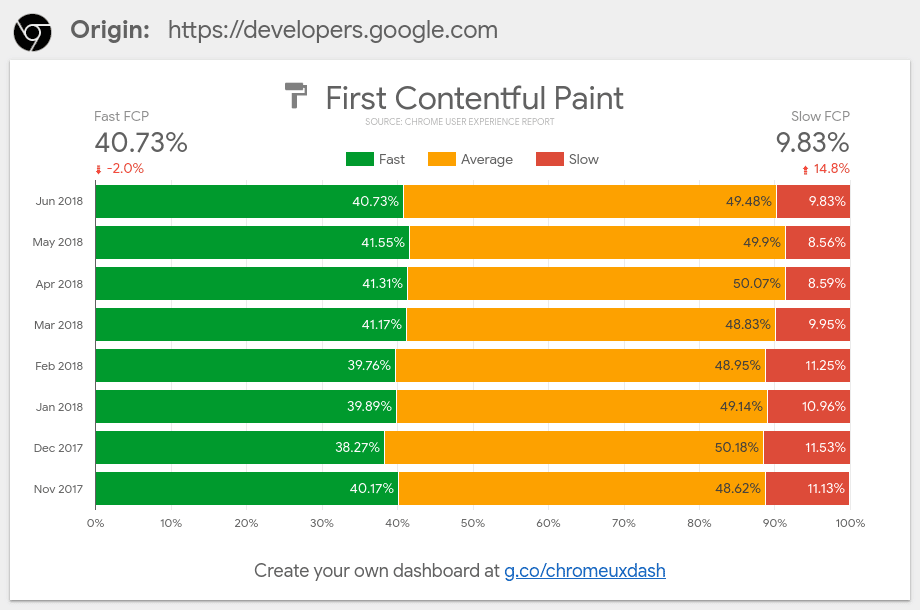
Today, Google developers have announced the introduction of Custom site performance reports with the CrUX Dashboard (Chrome UX report).
Google has repeatedly stressed the importance of user experience on site. Optimizing mobile page speed has been number 1 priority - and they've stressed that sites and pages that are under-performing or give less than a satisfactory user experience will be penalized. Afterall, they don't want to be directing users to sites that are slow, have low-quality content and full of ads and poor navigation.
Before your site is negatively impacted by poor UX - it is important to understand performance trends to make these into actional strategies and tactics for constant improvement.
How does the new CrUX dashboard work?
Google developers have stated:
"The Chrome UX Report (CrUX) enables you to track user experience and performance metrics for millions of origins -- and yes, you can even compare competitors' performance head-to-head!"
The report is easy to create and can be built on Google Data studio.
What insights can you see with the CrUX dashboard?
In a recent blog, they have stated that the CrUX dashboard has three ways to explore data:
- CrUX Dashboard
- BigQuery
- PageSpeed Insights
The Dashboard allows marketers to see how UX origin has changed over time. This function is automatically created and updated with unlimited free usage.
However, BigQuery only allows 1 TB of querying for free per month. You will need to sync a billing account to cover any surplus. BigQuery "slices and diced" raw data across a number of origins. It aggregates user experience metrics by origin and split across multiple dimensions.
- Effective Connection type (4G, 3G, 2G, offline etc.)
- Device type
- Country
On top of that, users can track different metrics.
"Metrics provided by the public Chrome User Experience Report hosted on Google BigQuery are powered by standard web platform APIs exposed by modern browsers and aggregated to origin-resolution." - Google Developers.
These can include:
- First paint (first time the browser after navigation - excludes default background paint)
- First contentful paint (first time the browser rendered any text, image, SVG or non-white canvas)
- DOMContentLoaded (first time the HTML document has been loaded
- Onload (this is when the page and all resources have finished loading)
Finally, PageSpeed Insights (something that was discussed at their Google Marketing Live conference last month) will allow users to see and understand the user experience of a single page / URL.


