Personalise your reporting with new calculated metrics
There is not a lot that you can’t do with Google Analytics these days, but one feature that has been missing for a while that the community has been requesting is Calculated Metrics. This feature is only available for properties using Universal Analytics and is currently in Beta.
In this post I have gone into some detail about what it is, why you should be exited, what you can do with it, and how to approach this new feature in your business by using examples.
Quick at a glance summary
- Google Announced in their November 2015 product update email newsletter
- Currently in Beta
- Only available for properties using Universal Analytics
- You can only have 5 Calculated Metrics per view (50 if you have the paid Premium)
- You need to have the right level of access in your GA account to create them
- You can mix any metrics or custom metrics together.
- Formulas are limited to 1024 characters.
- This feature is available for both Google Analytics and Google Mobile Analytics (AdMob) so you can get insights on your website and mobile app
- You can bulk copy your created Calculated Metrics between views
- You can delete and edit them
- They work on historical data, so you can get insights on data as far back as you have available
- To view you need to add them to a new or existing private or custom dashboard
What are Calculated Metrics?
Calculated Metrics give you the option to personalise your reporting by combining two existing metrics together to provide insights relevant to your business. What is a Metric? Every report in Google Analytics is made up of standard metrics, things like your users, sessions, page views. You cannot create Calculated Metrics using Dimensions.
Dimensions describe your data and give the characteristics of your users, their sessions and actions, for example the City that the visitor is from. If you are looking for insights on for example “which city responded better to campaign and used our app” then build an advanced segment. The Metrics measure the data, so your calculations need to be focused on the number not their labels.
You have the option to create a Calculated Metric with any Custom Metrics that you have previously created. What is a Custom Metric? Anything that is not in the standard reporting and dependent on your business and website/ app. For example you can create a Custom Metric for people who have logged into your website or not, how many sign ups you have had, or video plays.
Why is it useful for marketers?
This is going to be a real time saver for marketers as previously you needed to export data into excel or pull from Google Analytics API, and then do your calculations. Calculated Metrics save you that time as you can create your metrics and do the calculations directly in the interface to any time frame you like.
They will provide you with greater flexibility as you can get insights on questions that matter the most to you (some examples on this later) that were not otherwise available.
How should I use it? Which metrics are recommended
There are many Calculated Metrics that you can create, you can be as creative as you like, but what you don’t want to do is create metrics for the sake of it, you need to be in the mind-set to create a metric that is going to tell you something, give you some insights that you can take some action from. Otherwise you are just adding another metric to a report for reporting’s sake.
You only have 5 per view, so make them count. Charles Farina has given a list of 25 Calculated Metrics for Google Analytics for you to look over.
Google provide 2 use cases in their description of Calculated Metrics:
Revenue per user: Good to find out the revenue of your website users
- Name: Revenue Per User
- External Name: (automatically populated)
- Formatting Type: Currency (Decimal)
- Formula: {{Revenue}} / {{Users}}
Currency Conversions: Good to if you have a number of regions, you can apply this calculated metric to the countries view
- Name: Revenue from GBP to EUR
- External Name: (automatically populated)
- Formatting Type: Currency (Decimal)
- Formula: {{Revenue}} * 1.27
But what should you create? My advice is to go back to your business goals think about what questions you are looking to answer and go from there.
Or look at the 25 examples from Charles Farinas post and link to the RACE framework. Let’s put this to practice.
Hypothetical example:
I am a B2B website looking to generate leads. I have PPC campaigns to drive traffic to the site where I want prospects to read and watch thought leadership content (created Events in GA) with the ultimate goal to sign up to a webinar which will give Sales a lead. To access the webinar they need to create an account and sign in to view the content.
Formatting Type = CurrencyCalculation = {{Revenue}} / {{Users}}
Calculation = {{Revenue}} / {{Sessions}}
Formatting Type = Currency
- Lead Generation- contact information for sales prospects
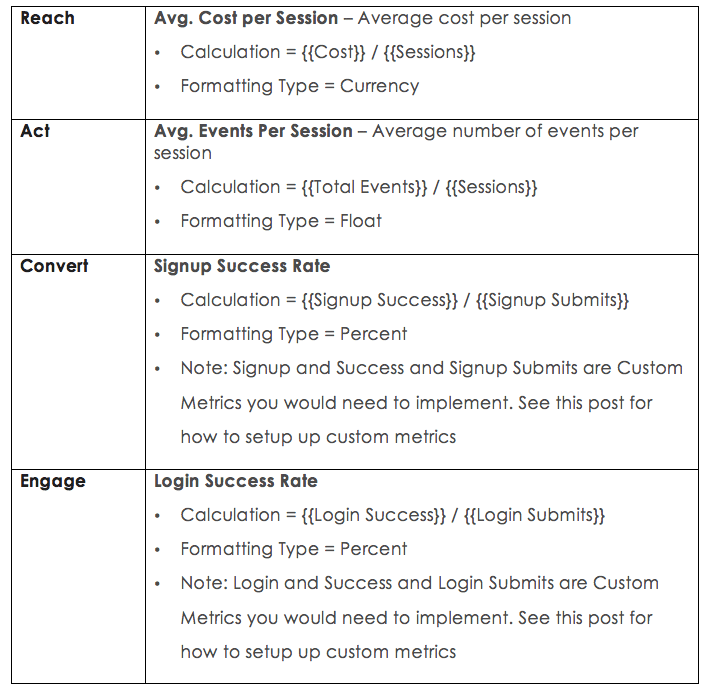
Calculation = {{Signup Success}} / {{Signup Submits}}
Formatting Type = Percent
Note: Signup and Success and Signup Submits are Custom Metrics you would need to implement. See this post for how to setup up custom metrics
- Content Publisher – show advertising to your visitors
- Blog views/ user , download/ user
Calculation = {{Blog Views}} / {{Users}}
Formatting Type = Float
Note: Blog Views is a Custom Metric you would need to implement
- Support- help customers solve problems
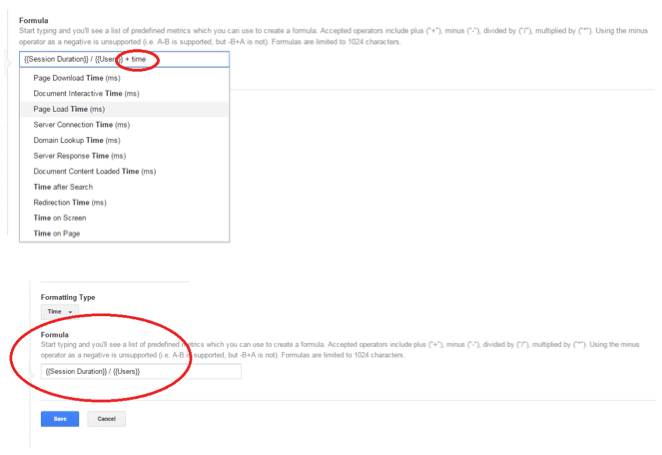
Calculation = {{Session Duration}} / {{Users}}
Formatting Type = Time
- Branding- drive awareness and engagement
- Average Events per Session
Calculation = {{Total Events}} / {{Sessions}}
Formatting Type = Float
How you can use this new feature for better reporting
Fancy having a go? Have an idea of the types of calculations you want to do inside GA and not export to excel, or just fancy seeing what insights you can get to your questions? It is simple to do, just check you have the right level of permission to edit and create in Google Analytics before you start, remember to do this in Testing view 1st, and nothing is set in stone, you can edit and delete your calculations.
Step 1:
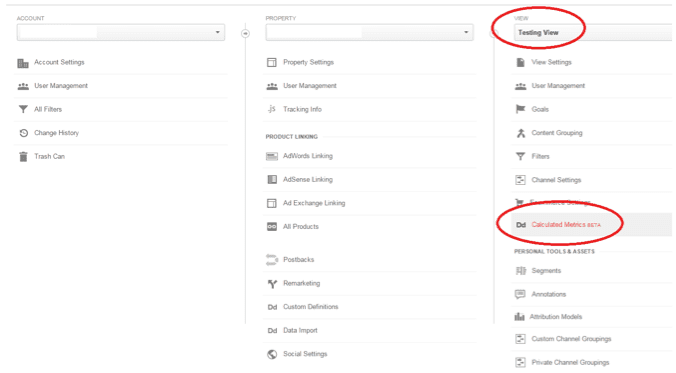
Log in to your account and click on Admin

Step 2:
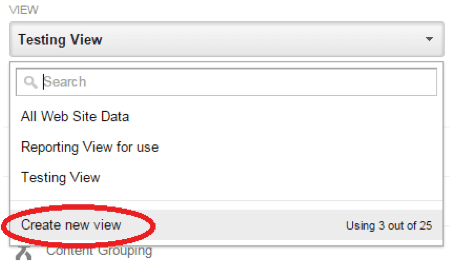
Select the view you wish to apply your Calculated Metric too. You should have at least 3 views- Raw data, Reporting Data and Testing Data, you can have up to 25 views, they are quick and easy to create just click ‘Create new view’ and follow the steps to complete.
Step 3:
In your chosen view select Calculated Metrics.
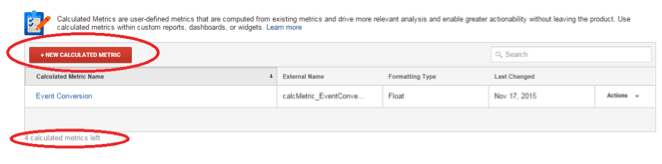
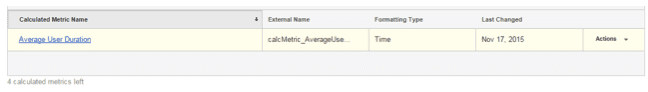
This will bring you to the Custom Metrics interface. Note that it will display any existing metrics set up on this view and give you a countdown (bottom left) of how many you have left. Click on the red button +New Calculated Metric
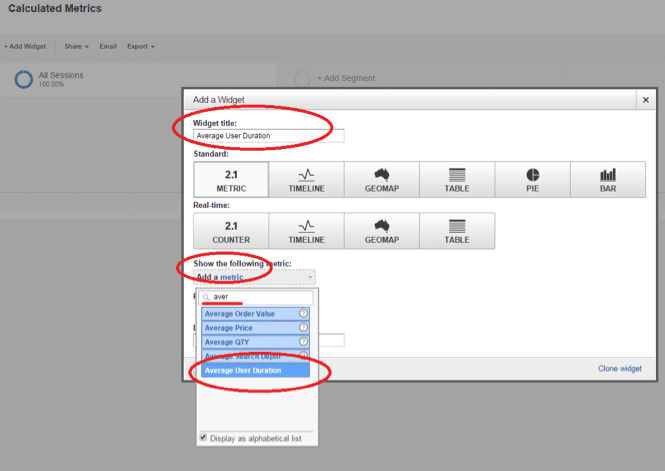
Step 4: Create your metric
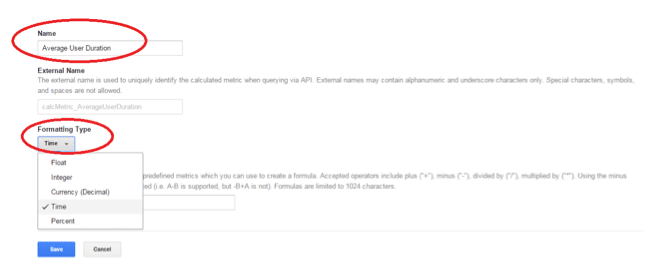
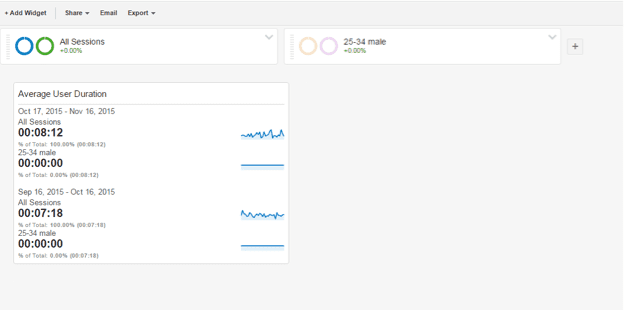
Name : Give your metric a name, make sure you are descriptive so it makes sense to users who have access to your data , eg Average User Duration not Calculated Metric 1.
External name: This will auto populate by the interface and you cannot change it. This is just how Google will query the metric.
Format type: You must select the formatting type from the dropdown. The posts we have linked to give the format type for you
Formula: Type in the metrics you want to calculate using the examples and use cases or start to type into the formula bar for options to populate and you can select from there. You have the option to use operators to divide (/), times (*) add (+) or minus (-). When you are happy with your formula hit save.
It should now be sitting pretty in your Calculated Metrics Interface.
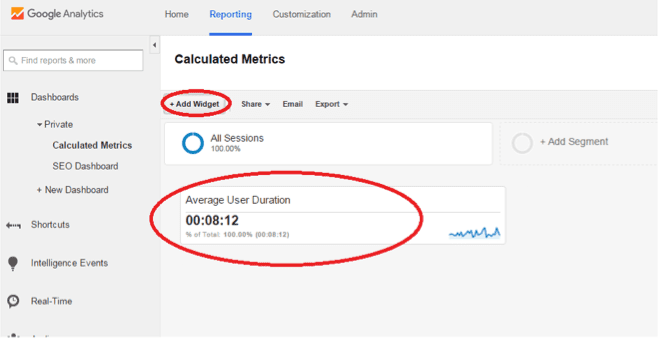
Step 5: View your metrics.
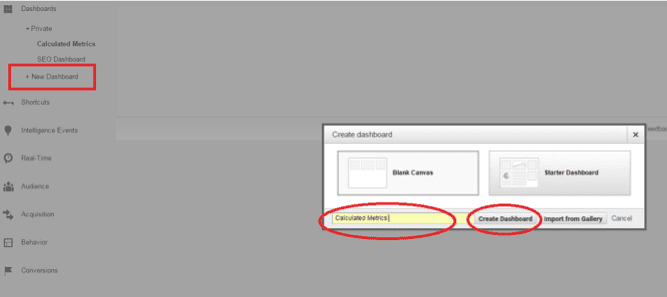
To view your data you need to add this to an existing private or custom dashboard, or create a new one with your metrics.
Click on reporting

If you don’t have a dashboard click + New Dashboard , give it a name eg Calculated Metrics , select Create Dashboard.
To add your new metric to your dashboard, click Add Widget, give it a name (use the same name you gave your Calculated Metric) and click on the metric dropdown list and start to type in your metrics name. Once you have found it, hit select and save.
Bingo, here is your new Calculated Metric. Remember you can only have 12 widgets to your private dashboard.
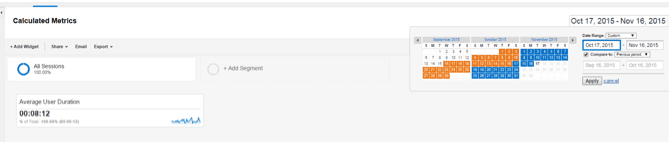
As with all dashboards, you can select time ranges to see performance.
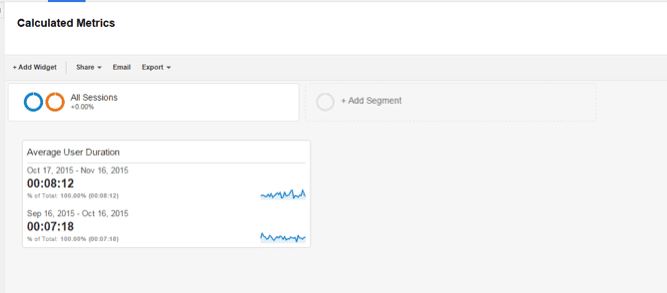
And you can drill down by segments.
If you need more help in structuring your analytic approach visit the Smart Insights Analytics portal
For further info visit: https://support.google.com/analytics/answer/6121409


