Chart of the Day: An example of the 'Critical few' KPIs
To coincide with the release of an enhancement to our RACE digital marketing dashboard, today's Chart of the Day isn't published research around digital marketing. Instead, it's what I think is a nice, practical example of achieving focus through a marketing dashboard:
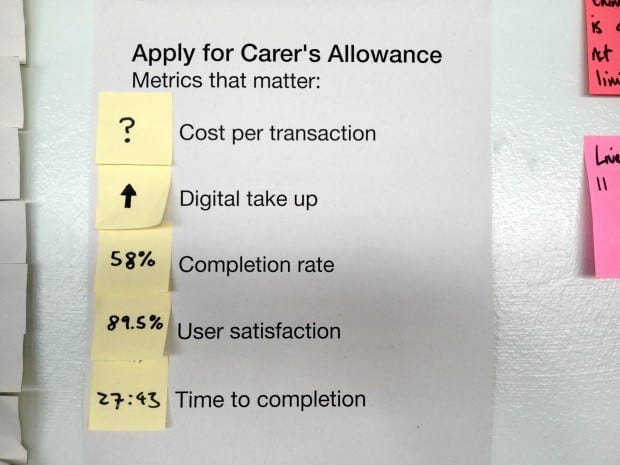 The visual dashboard above is a well-known dashboard example, taken from the well-regarded source of sharing approaches to managing Digital Business - the UK government's digital service.
Their article explains that when they're building a digital-by-default service like Carer’s Allowance, their team is continuously designing, testing and releasing changes to the live service to improve it and better meet user needs against critical KPIs of which standard usability measures like completion rate, user satisfaction and time to complete are most important.
They explain that, as a team, testing innovation they're moving away from detailed analytics reports to performance dashboards:
"Analytics reports have their place but they don’t help agile product teams make informed decisions while moving fast. We prioritise and release changes every 2 weeks and need to know quickly how the latest changes are performing.
Key metrics are data points that change over time depending on how well the service is meeting user needs. They relate directly to how easy, quick, or understandable the transaction is for users".
That's an approach to measurement and improvement which applies equally to commercial businesses and it certainly informs our approach to testing and use of dashboards for weekly and monthly reporting and review. In our main member's dashboard for Google Analytics we have selected just 4 measures for each part of the RACE funnel from the many, many measures available in Google Analytics and channel measures for each are shown in a drill-down.


