Facebook dominates social media by audience reach AND engagement
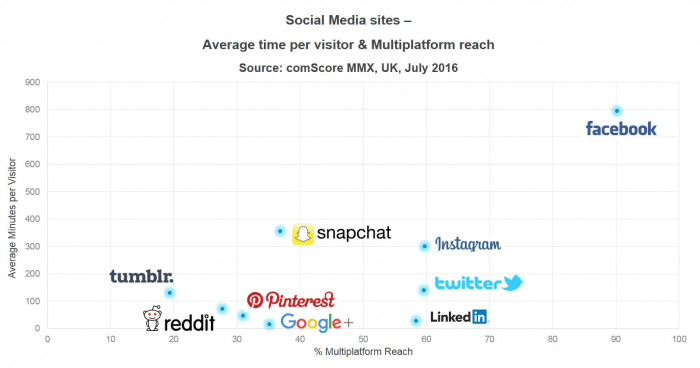
We all know Facebook is the most popular social network. Yet it's useful to be reminded how important it is since it helps us prioritise our marketing focus accordingly. This comScore 'Digital Future in Focus' report shows the importance of Facebook in an interesting format since it shows levels of audience engagement with the platform compared to reach.

By comparing Reach on the X-axis against Engagement on the Y-axis we can see how far ahead Facebook is compared to the other social networks. This data is for a younger US audience, but the report shows a similar pattern for an older audience and the 'Future in Focus' series covers other countries too. Note that this picture could be considered a little misleading if it was a desktop only panel, but it also include mobile where the majority of social media is consumed
This US research was taken from the most recent comScore Digital Future in Focus report in March 2016 and since this time comScore have shared a similar chart for the UK showing social media engagement for millenials (18 to 34). The relative importance of the social networks are similar in both charts, but Reddit is included for the UK one.
When reviewing social network reach vs engagement it's useful to think about how this varies by platform, particularly since the proportion of social network use on smartphones is so high. The average smartphone user spends in excess of 2 hours a day looking at their screens, either texting, browsing the internet, scrolling through emails and more often than not using apps.
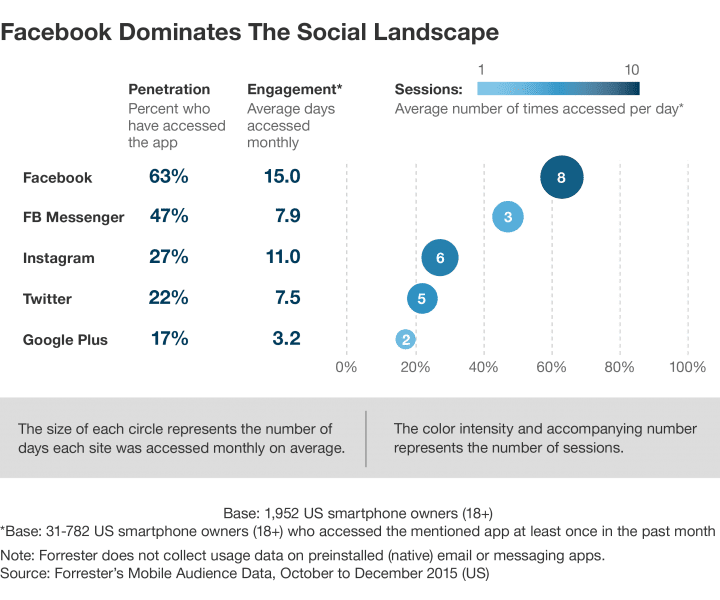
Now it's the use of apps in particular which is the focus of this article, more specifically around social networks. The below chart compares the reach of social media, as well as the average number of days per month and the sessions per day.
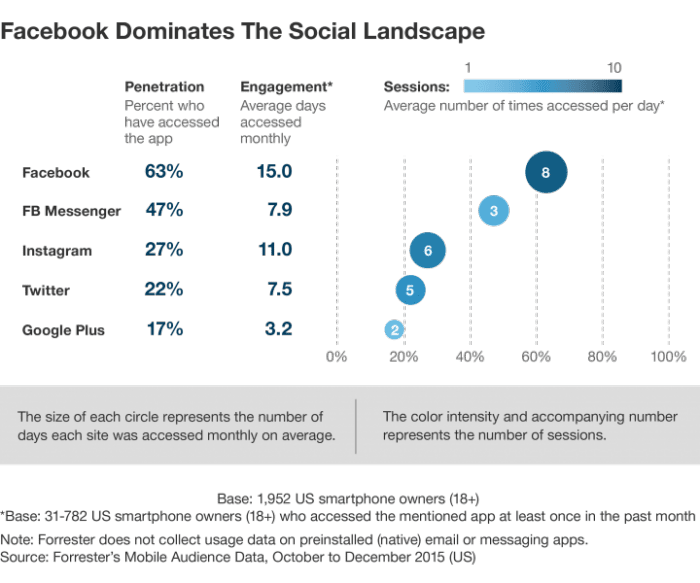
One of the most pertinent takeaways from the Forresters Report, is just how "addictive:" Facebook is. The chart breaks down the amount of touch points or "session" we have with the apps throughout the day. Facebook leads the way with on average 8 sessions, per day used. Followed by Instagram with 6 and Twitter with 5. This highlights the constant need for communication and content, we need everyday.
This chart, once again, highlights the dominance Facebook has over their competition, with a penetration rate of 63%, a whole 35% higher than the next closest competitor Instagram. Twitter performs favourably too, with a 22% penetration rate, however it is somewhat overshadowed by Facebook's dominance.
Facebook are again out in front in terms of Engagement, on average being accessed around one day out of every two. Instagram aren't far behind, as it is being accessed on average one day out of every three.
Download Expert Member resource – Smarter Facebook Marketing Guide
This guide will allow you to create a plan for managing Facebook communications in your company or for your clients. It will help you grow your following and use Facebook more cost effectively.
Access the Smarter Facebook marketing guide