Chart of the Week: 55% of marketing influencers believe that improving decision making is the primary objective for a marketing data dashboard
A marketing data dashboard is a helpful tool that can allow marketers to visualize KPIs relating to the impact of their marketing efforts. It can help KPIs be easily and immediately understood, making a marketing data dashboard useful for reporting and tracking.
However, there are a number of different tactics and strategies that can be used when it comes to visualizing data using dashboards, as well as different trends. To see what some of the most popular and useful methods are, Ascend2 surveyed 307 marketing influencers for its Visualizing Marketing Data with Dashboards report.
What is the primary objective for marketing data dashboards?
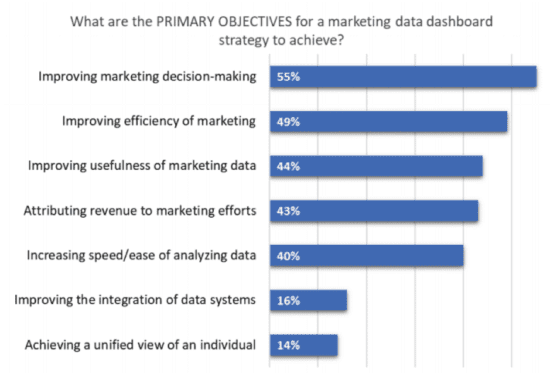
Over half (55%) of survey respondents said that the primary objective they want their marketing data dashboard strategy to achieve is ‘improving marketing decision-making’. As data can help to inform decisions and ensure you are moving in the right direction, it makes sense that this is an objective that marketers want their dashboards to help with.
Easily accessible and visual data can make quick decisions simpler while still ensuring the right information is being considered.
Leading on from this, 49% said that ‘improving the efficiency of marketing’ was a primary objective while 44% reported that ‘improving usefulness of marketing data’ was. Additionally, 43% said their objective for a marketing data dashboard strategy was to ‘attribute revenue to marketing efforts’. All of these objectives can not only ensure that marketing is more effective, they can also help get buy-in from decision makers when it comes to future marketing efforts.
The survey also asked what the most key performance indicators that a marketing dashboard should track. ‘Marketing ROI’ took the top spot with 56%, closely followed by cost-per conversion (46%) and campaign performance (45%).
Only a quarter (24%) said that social engagement was a KPI that should be tracked by a dashboard, which could be because this metric is fairly easy to track via social channels.
Are marketing data dashboards successful?
No matter what the primary objective is for a marketing data dashboard strategy, the majority of respondents find them to be successful. In fact, just a small 3% say that their dashboard strategies are unsuccessful.
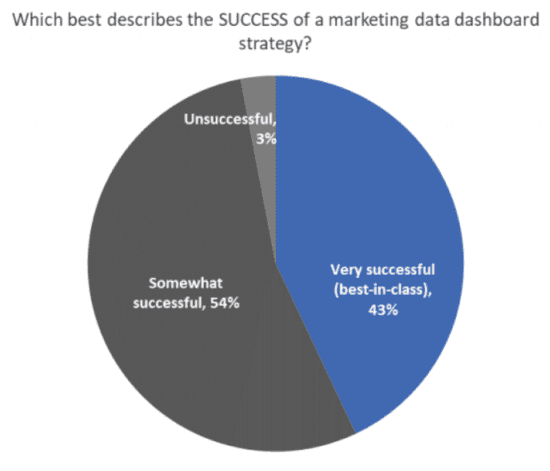
Comparatively, 43% say their strategies are very successful while just over half (54% say they are somewhat successful. Understanding what you want to get out of visualizing your marketing data will ensure your dashboard is set up correctly to achieve your objectives, ultimately meaning your dashboard strategy is more likely to be successful.
Challenges to success
When it comes to the critical challenges that could affect the success of a marketing data dashboard strategy, the one selected by 49% of respondents was ‘attributing revenue to marketing efforts.’ Proving ROI isn’t always a straightforward process and working out what data will successfully show the revenue created by certain marketing actions may not be simple.
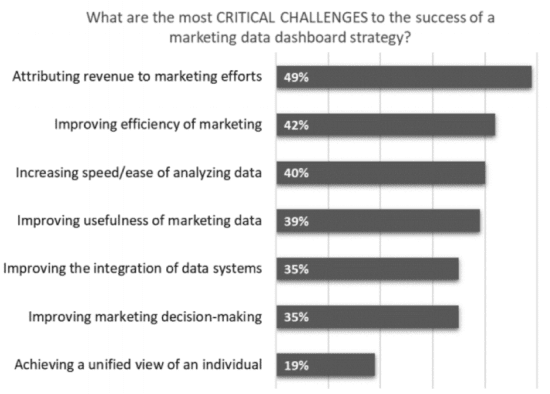
As marketing data dashboards are all about visualizing data in an easy-to-digest way, this can mean that they may not necessarily be suitable for assigning revenue to marketing efforts.
Other challenges included ‘improving efficiency of marketing’ (42%), ‘increasing speed/ease of analyzing data’ (40%), ‘improving usefulness of marketing data’ (39% and ‘improving the integration of data systems’ (35%).
Increasing budgets
While marketing data dashboards are a useful tool, most marketers have found that they are taking more resources to create. Some 70% say that total budget – including time, resources and expense – will likely increase moderately for a dashboard, while a further 14% say the budget will increase significantly.
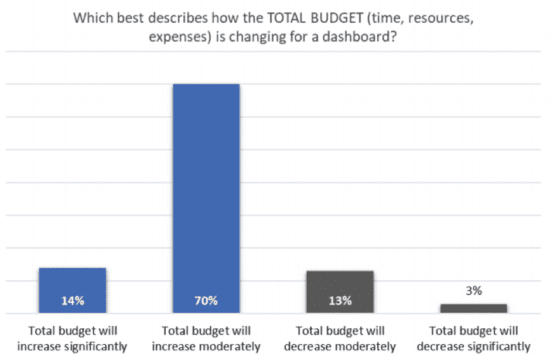
Only 16% of respondents say that the budget it takes for a dashboard – creating and maintaining – is decreasing, suggesting that marketers looking to make the most of the benefits offered by this tool need to assume that the investment in terms of time, money and resource is likely to increase.
However, if a marketing data dashboard can help give good visibility of your KPIs, creating and updating it is likely worth the overall budget, especially compared to the time it can take to create a report without using one.
It is likely that costs increase for marketers when they use a combination of in-house and outsourced resources, which the majority of respondents said they do.
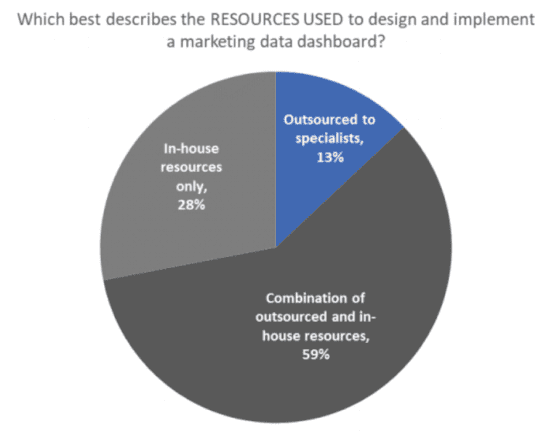
A total of 59% use both outsourced and in-house resources, which will result in higher costs, as well as more time being spent as companies need to brief the design of their dashboard, grant access to analytics and go through a number of channels before the dashboard is completed.
Designing a dashboard
Designing a dashboard is just as important as understanding what data it needs to show. The design needs to make sense as you scroll through and include the right data presented in the correct way.
This is why it isn’t really surprising that when asked what the most important questions to ask for dashboard design effectiveness are, 54% said ‘what are the right metrics?’ Understanding what you want to track and which metrics follow on from others will be a big part of the design of a dashboard.
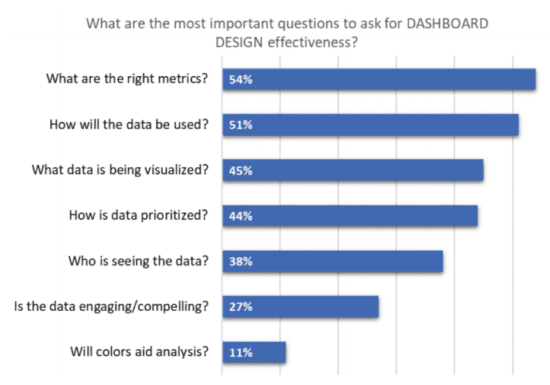
Another important question as suggested by over half (51%) of respondents was ‘how will the data be used?’, as knowing this can help you decide the best way for it to be visualized. Other questions deemed to be important for dashboard design effectiveness are ‘what data is being visualized’ (45%), ‘how is data prioritized?’ (44%) and ‘who is seeing the data?’ (38%).
On a more practical note, 11% also said that asking ‘will colours aid analysis?’ could lead to a more effective dashboard overall.
Final thoughts
Marketing data dashboards can be an effective way to display data and make sure metrics are easily accessible across different departments. Ensuring you understand what metrics should be displayed, how you want the data visualized and how the data ties into your marketing KPIs can ultimately reduce reporting time and lead to a better understanding of overall performance.
You can also use this type of dashboard to indicate strong performance or areas that need work to those who may not necessarily have a deep understanding of analytical tools but who are involved in any decision-making processes. This can mean that it becomes easier to get buy-in and support for future marketing campaigns.
With 28% of survey respondents saying their dashboards are completed and in use, with a further 41% saying dashboard implementation is in progress, it is highly likely that this tool could be beneficial to most organizations.


