Frameworks and mindtools to create digital audits, strategies, and plans
Choosing the right digital marketing model to suit your business is imperative! We cover 10 different marketing models across audit, planning, and strategy, including Smart Insights’ own RACE Planning Framework!
We also have a guide on the different marketing models, how to use them and practical advice to implementing them in your business. See digital marketing models.
Audit Models
- Forrester’s 5Is
- Lauterborn’s 4Cs
- Ten C’s of Marketing
Planning models
- 6Cs of customer motivation
- Hofacker’s 5 stages of information processing
- RACE planning
- Technology acceptance model
Strategy models
- 4Cs for marketing communications
- McKinsey’s consumer decision journey
- The Honeycomb model
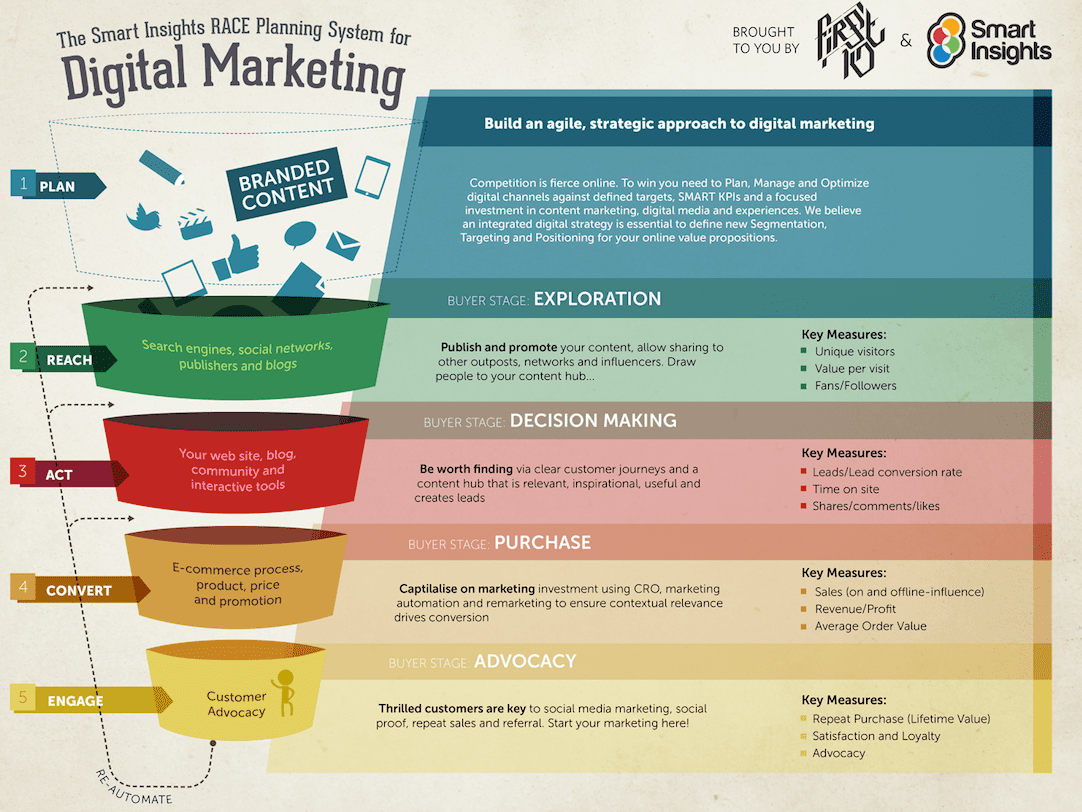
RACE Planning Framework
RACE Planning is a practical tool focused on increasing the commercial returns from digital marketing across the RACE conversion funnel shown at the end of this section. It features an initial planning phase to create a strategy with defined Objectives and KPIs for evaluation. Best practices are then developed to manage and optimize communications in an integrated way across the many online and offline customer touchpoints that are involved when a consumer selects a product or service today.
For a full overview see our RACE Planning Framework page.

4Cs for marketing communications
The 4Cs (Clarity, Credibility, Consistency, Competitiveness) is most often used in marketing communications and was created by David Jobber and John Fahy in their book ‘Foundations of Marketing’ (2009). Once a business has segmented its marketing and identified the target audience, the next stage is to position the business. To successfully achieve this, the 4Cs is a useful tool to create a positioning statement or to build an online value proposition.
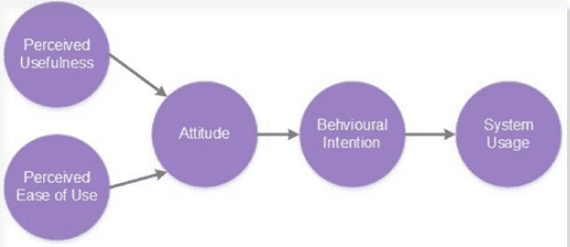
Technology Acceptance Model
The Technology Acceptance Model (TAM) is largely credited to Fred Davis in 1989 when he was part of the Computer and Information Systems, Graduate School of Business Administration at the University of Michigan in the US. This was at a time when computers were being introduced into the workplace and Davis was looking for a way to predict and explain system use both for vendors and IT managers.
TAM was designed to measure the adoption of new technology based on positive attitudes towards two measures:
- Perceived usefulness
- Perceived ease of use
Many businesses are developing apps, creating online portals and extending their websites to incorporate ‘login’ areas. The TAM is an ideal tool to test with a small group, before making major investments and rolling out a system which may not be adopted.
BCG Matrix Model
The Boston Consulting group’s product portfolio matrix (BCG matrix) is designed to help with long-term strategic planning, to help a business consider growth opportunities by reviewing its portfolio of products to decide where to invest, to discontinue or develop products. It’s also known as the Growth/Share Matrix.
The Matrix is divided into 4 quadrants derived from market growth and relative market share, as shown in the diagram below.
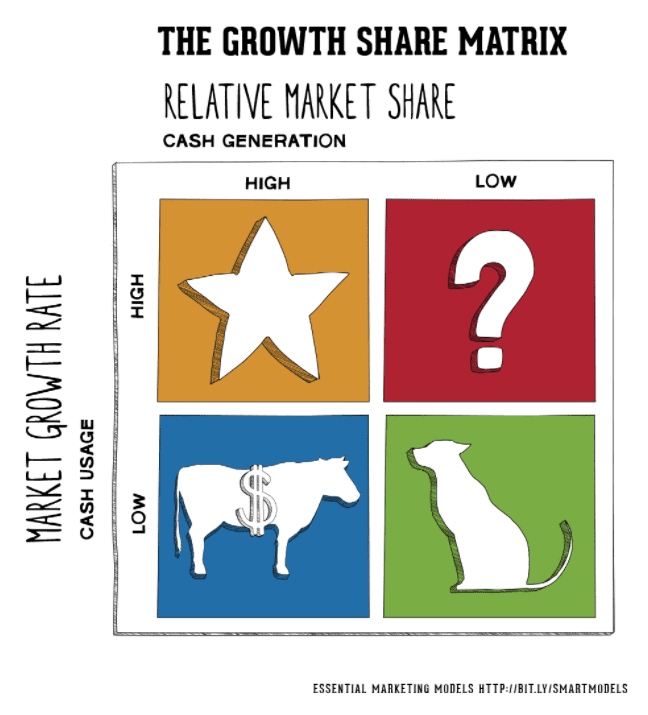
How to use the BCG matrix:
- Dogs: The usual marketing advice is to remove any dogs from your product portfolio as they are a drain on resources. For example, in the automotive sector, when a car line ends, there is still a need for spare parts. As SAAB ceased trading and producing new cars, a whole business has emerged providing SAAB parts.
- Question marks: Named this, as it’s not known if they will become a star or drop into the dog quadrant. These products often require significant investment to push them into the star quadrant. The challenge is that a lot of investment may be required to get a return. For example, Rovio, creators of the very successful Angry Birds game has developed many other games you may not have heard of. Computer games companies often develop hundreds of games before gaining one successful game. It’s not always easy to spot the future star and this can result in potentially wasted funds.
- Stars: Can be the market leader though require ongoing investment to sustain. They generate more ROI than other product categories.
- Cash cows: ‘Milk these products as much as possible without killing the cow!. Often mature, well-established products.The company Procter & Gamble which manufactures Pampers nappies to Lynx deodorants has often been described as a ‘cash cow company’.
For more models, and how to use them see our Digital Marketing Models guide.