How is cart abandonment and remarketing changing in 2017?
The global cart abandonment rate for Q1 2017 was 75.6%, down 1.2% from the previous quarter, which included the Christmas shopping season.
This data is taken from more than 500 ecommerce sites and tracks abandonment rates across six key sectors.
There is plenty of variance between the sectors studied, and it's interesting to see why. For example, while fashion site experience lower than average abandonment rates, at 68.3%, abandonment in the finance sector is much higher, at 83.6%. Travel sites also experience high abandonment rates, at 81.7%.
Broadly speaking, the more complex the on-site experience and purchase process, the higher the abandonment rates. So, a fashion retailer with a simple checkout and relatively low-cost items will experience fewer drop outs than a travel site with more expensive products and longer forms to complete.
We know from other data that mobile web traffic is now outpacing desktop, but often the sales volumes are proportionally much lower on mobile.
The stats bear this out, with 51.3% of retail traffic coming from mobile devices yet just 36.8% of sales. Click on the infographic below to see an enlarged version.
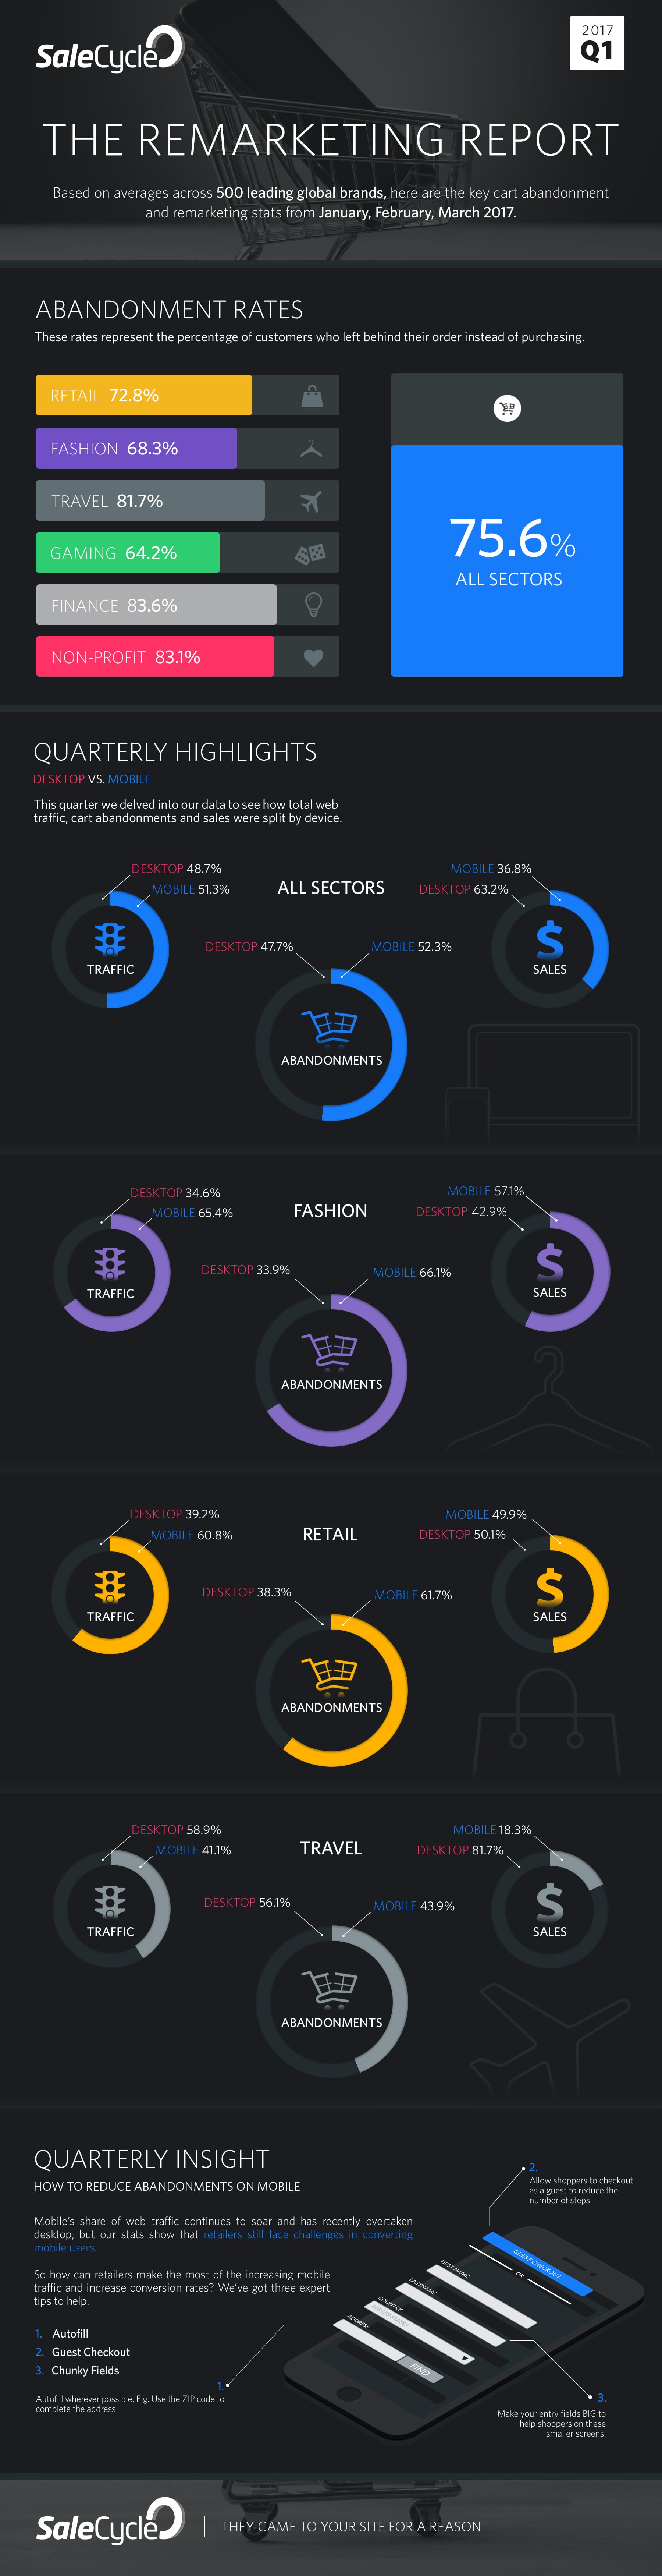
Thanks to Salecycle for creating this infographic.


