Chart of the Day: How do your Adwords campaigns compare?
Do you know what a top-performing AdWords campaign looks like? The new Paid Search Benchmark 2018 report by Adthena is a useful compilation of ad spend and performance, cost and competition and competitive diversity across the UK, US, and Australian paid search landscape.
This report benchmarks ad spend and performance in search, and encompasses data from over 140 million paid search ads, 135,000 advertisers, and 5.6 million search terms in the US, UK, and Australia, revealing global search trends and category-specific insights.
Mobile vs Desktop average CTR
Knowing what device your potential audience is using for their search query is important. you need to make sure your desired landing pages are optimized for mobile use (not that it shouldn't be anyway), but if you're paying for a user's click you want to be getting their conversion too. Mobile CTR was far higher in Q4 2017 than desktop averaging 10% CTR. 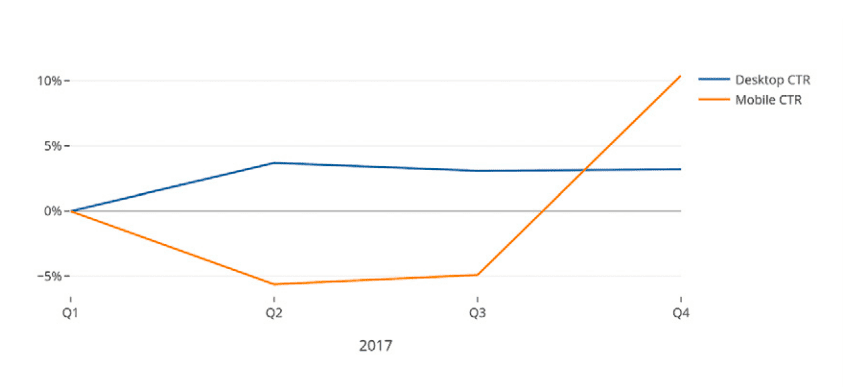
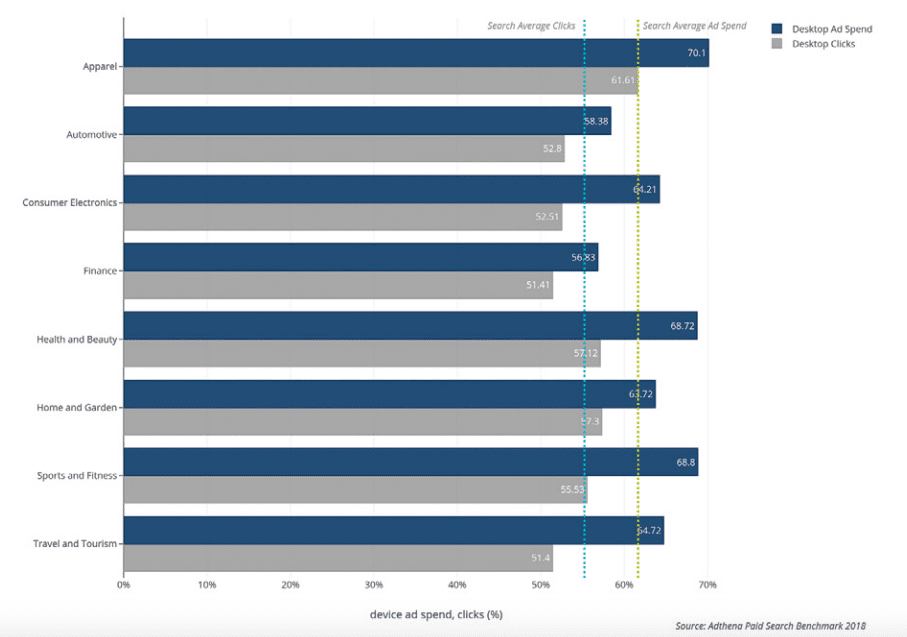
US category ad spend vs clicks (desktop)
US and UK markets differ in ad spend depending on search volume and country demand. Not all industries perform the same, with some having larger audiences than others. However, a common trend sees higher average ad spend on apparel, sport and fitness and travel and tourism. Automotive, consumer electronics, and finance have a below average click rate at approximately 51-52% in the US.
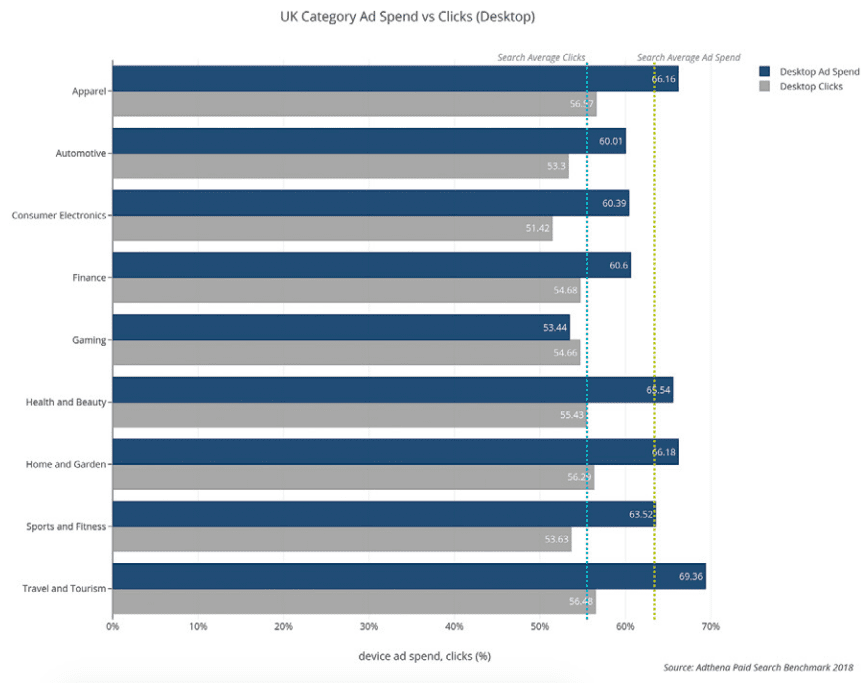
In the UK, desktop ad spend is booming for travel and tourism, apparel and home and garden. However, very little reach or exceed the average clicks %.
US: Average CPC, by device, pure brand / generics
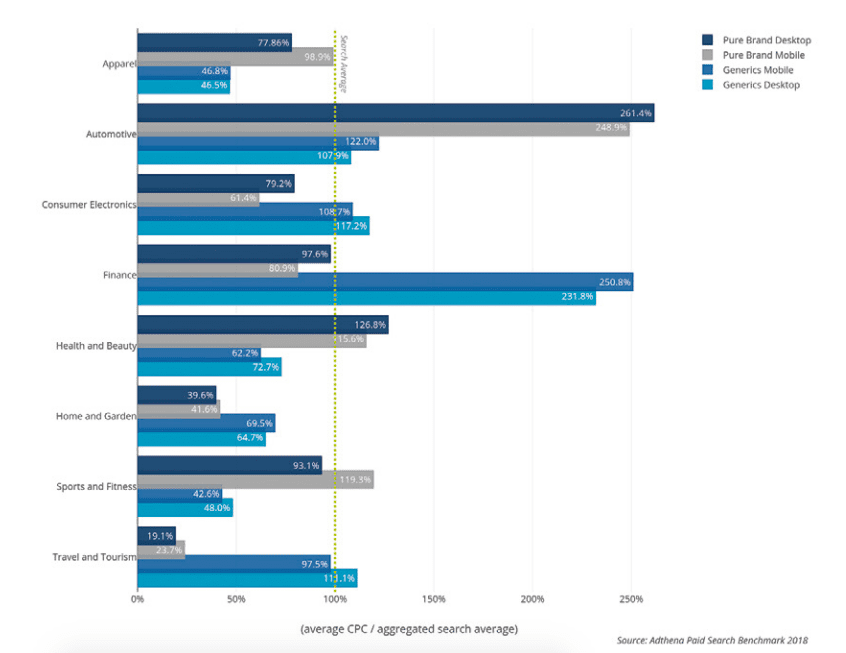
Finance and automotive have the highest CPC in the US. Due to the high level of competition and the value of a conversion, clicks are costly. Travel and tourism have higher generics than brand, mirrored in the search behavior of looking for a destination rather than a specific airlines or holiday maker.
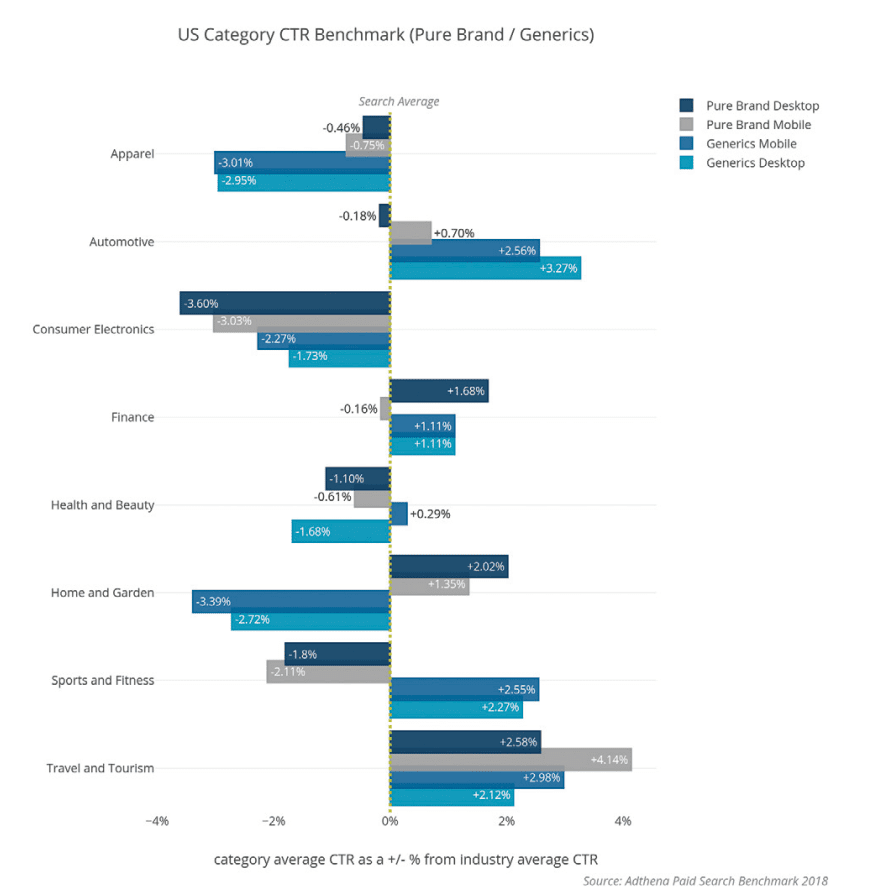
US: Avg CTR, by device, pure brand / generics
To see the full breakdown of ad spend - download the full report here: Paid Search Benchmark 2018 report.