Key PPC budgeting lessons for modelling AdWords investment for B2B companies
At any one time, there are only a finite number of potential clients searching for your product or service that you could convert to an enquiry. Above this point, throwing more money at Pay Per Click or AdWords advertising will simply buy more traffic that will not convert to an enquiry. By analysing your data over a statistically significant amount of time it is possible to estimate the optimum PPC budget that will maximise customer enquiries and minimise money wasted chasing enquiries that aren't there. Here I outline an example of a UK manufacturer running a B2B campaign who reduced their PPC spend by 30% to deliver the same level of customer enquiries. The article then goes on to discuss applying the approach to your organisation.
PPC budget - the £700 rule of thumb
Deciding you optimum PPC budget is a difficult judgement call to make. Too little spend and you are missing out. Too much spend and you are wasting your budget. With a consistent flow of customer enquiries this isn't hugely difficult, but if customer enquiry levels can vary wildly on a daily and monthly basis it becomes much more difficult to identify the relationship between PPC spend and enquiries. Conventional wisdom suggests £700 per month is a budget you should bear in mind. I don’t know who decided this but it is a good place to start. However, it is a huge simplification which doesn't take into account many factors.
Part one - The case study
Recently I analysed data for a hi-tech UK manufacturer which showed how they could reduce their average monthly PPC spend by 30% and still expect to get the same level of customer enquiries. I had access to almost three year's worth of data:
- The number enquiries per month (via email and web-form)
- The monthly spend on Google PPC
1. Applying a trend line to normalise for business growth
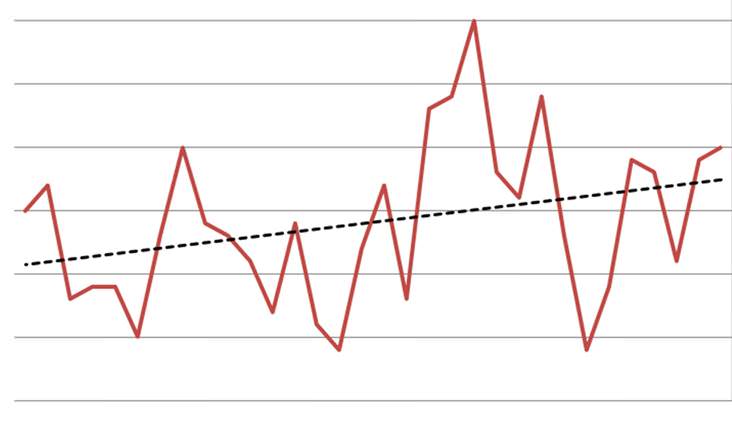
Enquiries had grown at around 10% per annum. The data needed to be corrected so that all three years would have equal weight within the analysis. By adding a linear trend line and using its equation (this is something Excel generates automatically) I was able to create an expected level of enquiries for each month, assuming zero fluctuation.
2. Identifying and correcting for calendar variation
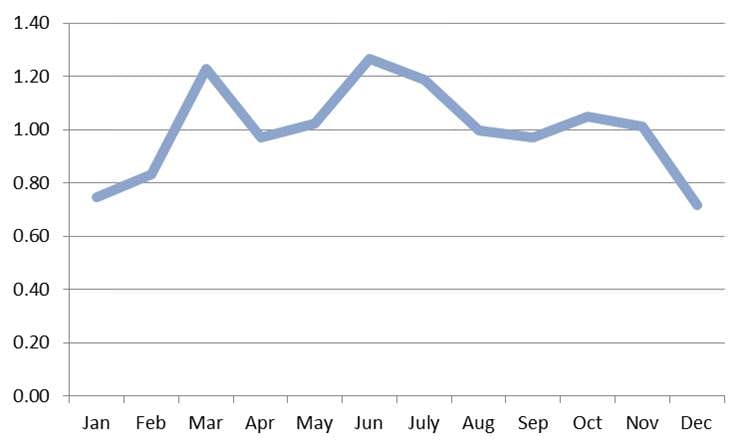
Until I mapped customer enquiry numbers by calendar month the organisation hadn't recognised there was a seasonal fluctuation to the enquiry levels. This sounds obvious but it can be difficult to spot if you have multiple business or product lines with different dynamics arriving via the same channels - especially if enquiry rates are volatile.
3. Calculating "predicted" enquiry levels
By multiplying the enquiry level suggested by the trend line (lets say 33 for example) by the seasonality factor (e.g. 0.78) we can establish the expected enquiries for each month. In this example 33 x 0.78 would be 25.7 enquiries. The next step would be to compare this set of predictions with the real enquiry numbers.
4. Performance = actuals v predicted to identify performance
By comparing actual enquiries with predicted enquiries we are able to create a performance ratio. In the monthly example above - if the actual level was 22 enquiries versus our predicted level of 25.7 then the performance ratio for that month was 85%.
5. Finally, comparing performance against PPC spend
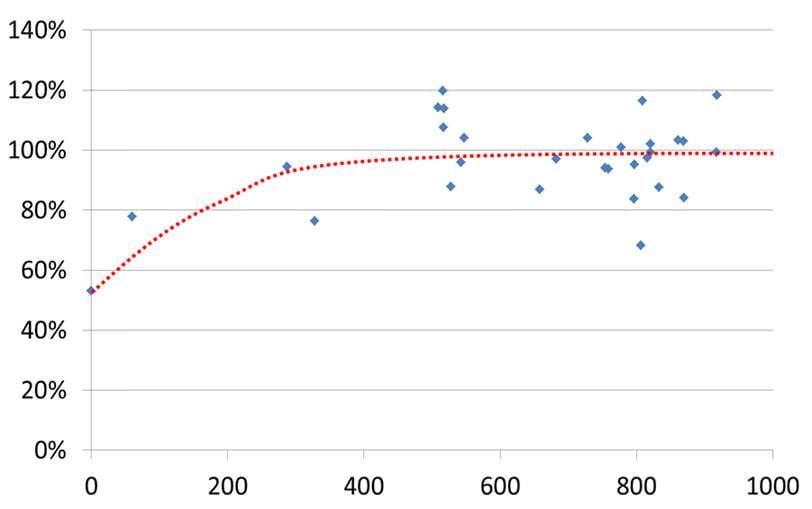 By using a scatter graph to map the performance for each month against the corresponding PPC spend we are able to investigate the impact of spend (£) on the enquiry levels
Conclusions
This analysis suggests:
- Approximately 50% enquiries would still occur if the PPC budget were reduced to zero. This makes sense - PPC is obviously not the only source of traffic. Some customers will arrive via different channels e.g. organic search engine results, referrals or even direct to the website if they know the company already.
- Monthly enquiries remain between 80% and 120% of expected levels from around £450 per month upwards. In other words, any additional spend above this point does not appear to have an impact on the enquiry levels.
There isn't much data at low spending levels because the company wasn't keen to lose out on enquiries at the expense on generating a few data points. However, this analysis does paint a clear picture and the model can be improved as more data becomes available. Reducing the PPC spend down to £450 per month could save this company £3,000 per year that could be spent more effectively. So much for the conventional wisdom of £700 per month.
PART 2 - Applying this approach to your organisation:
Before applying this same analytical approach to historical data from your own organisation you need to be mindful of a few things:
Quality of data #1 - You need a spread of data points
In order to investigate the effectiveness of PPC spend over a range, you need to have a range of data over that same range. If your spend hasn't varied much then you are going to struggle - in which case you should think about distributing your budget unevenly (e.g. switching off then doubling up) to improve the quality of your data. This case study works because:
- There were a number of period where spending was significantly increased because it was assumed, incorrectly, that this would generate more enquiries.
- The campaign was actually switched off for around 9 weeks which affected the spend in three calendar months - providing three data points at a significantly lower spend level than usual.
Switching off a campaign isn't too popular with other departments in an organisation such as sales and senior management. Describing it (correctly) as an "uneven distribution" of the budget will cause less panic than telling them you are going to stop advertising.
Quality of data #2 - Enquiry "lag" versus analysis period
Be mindful of the time taken from initial click to enquiry submission. If it takes a typical customer a week from initial touch-point to submitting an enquiry then analysis on a DAILY basis is unlikely to be effective. In B2B, purchases are typically higher value, higher complexity and higher risk than in B2C - therefore this "gestation" period can be significant.
Quality of data #3 - You need enough data
A handful of data points is not statistically significant enough to tell a clear story. If your data is limited you should consider frequent updates to your analysis until the story isn't changing much and you can be confident in your conclusion.
Quality of data #4 - Reduce the volatility of the data
You need to choose whether to analyse your data on a daily, weekly or monthly basis. If you can go three days without a customer enquiry and then get 6 in one day (all with a consistent daily PPC budget) then daily time periods are not suitable for your analysis. However, if you get dozens of enquiries a day - then a daily time period is probably fine. You need to smooth out the data so that the level of volatility is not present in the comparison of performance versus PPC spend.
Quality of data #5 - Seasonal adjustments
You should consider making "seasonal" adjustments on all the time periods you use. Different days, weeks and months will be more fruitful than others, for perhaps a multitude of reasons which don't need to be identified for the analysis to work. Accounting for annual growth is effectively a seasonal adjustment on a yearly basis.
Beware of many other factors
There are of course other factors in the PPC equation:
- The nature of the product or service - e.g. commodity through to super-niche - will influence both the level of demand and the likelihood of a visitor submitting and enquiry.
- The geographical area(s) you are targeting e.g. local area /UK / Europe / worldwide
- The intensity of competition for your keywords - increased competition will affect the cost per click.
- How well you have chosen your keywords - long-tail keywords are so much more cost-effective than generic ones because there will be less competition and these will be better targeted to your customers.
- The effectiveness of your Ad text i.e. how effectively they induce your potential customers to click.
- How effectively you are bidding e.g. what is your average ad position?
Analysing your own data statistically can help you understand the effectiveness of your PPC spend and help prevent you chasing customer enquiries that aren't there. However, it cannot take into account how well crafted and optimised your campaign is. See (4), (5) and (6) above. Good luck getting the best bang for your buck!

Thanks to Edward James for sharing his advice and opinions in this post. Ed is a consultant at Manchester-based content marketing agency -
Gingerbolt Marketing


