A review of 9 new features in Google's consumer search behaviour insight tool
When the Google Keyword Tool was removed and replaced with the Keyword Planner, approximately a year ago, the ability for marketers to filter traffic estimates by device was lost. It was no longer possible to see the volume of searches by consumers made on mobile devices including smartphone and tablet.
However, with the introduction of nine new features to the Google Keyword Planner Tool last month, users will now have greater insight into mobile device volumes, mobile trends, enhanced location breakdowns and how this data trends over time.
In this post, I’m going to focus on the mobile and location enhancements, which offer some really useful data and allows us to consider how we can optimise our sites more effectively for mobile and tablet searchers.
Contribution of search volume for keywords by device
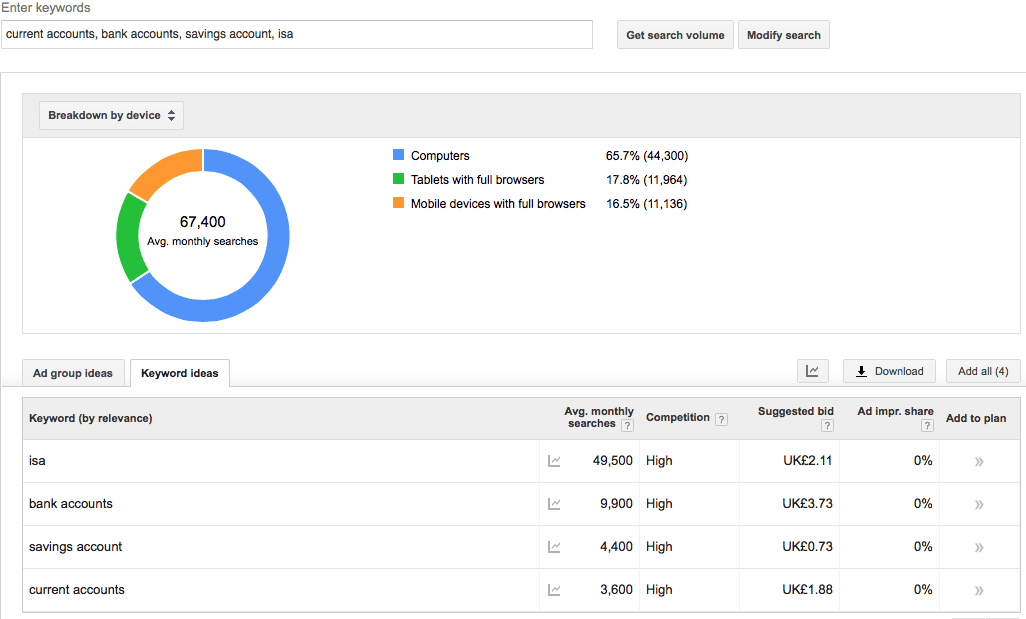
From the nine new features Google have introduced, different businesses will gain something different from each of them. But one of the most exciting features that’s likely to interest both small and larger enterprises alike is the re-introduction of device search insights:
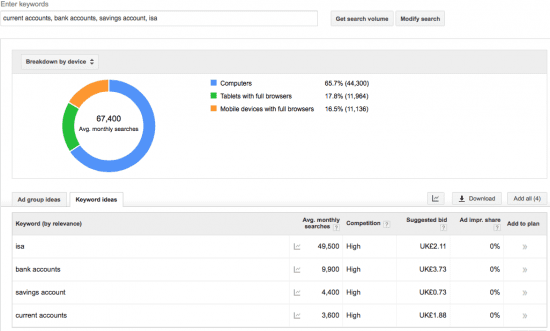
This feature provides visual data to enable users to understand the expected search volume contribution from individual devices. As you can see from above, a group of keywords representing a particular theme or topic can be analysed to get an aggregate volume of searches, in total as well as broken down by device type.
This type of data allows one to see how people are searching online for particular terms and phrases.
For example, if it’s clear that a relatively equal volume of searches is coming from tablet, mobile devices and desktop computers, the data could be useful for building a business case for SEO investment in a responsive or adaptive website.
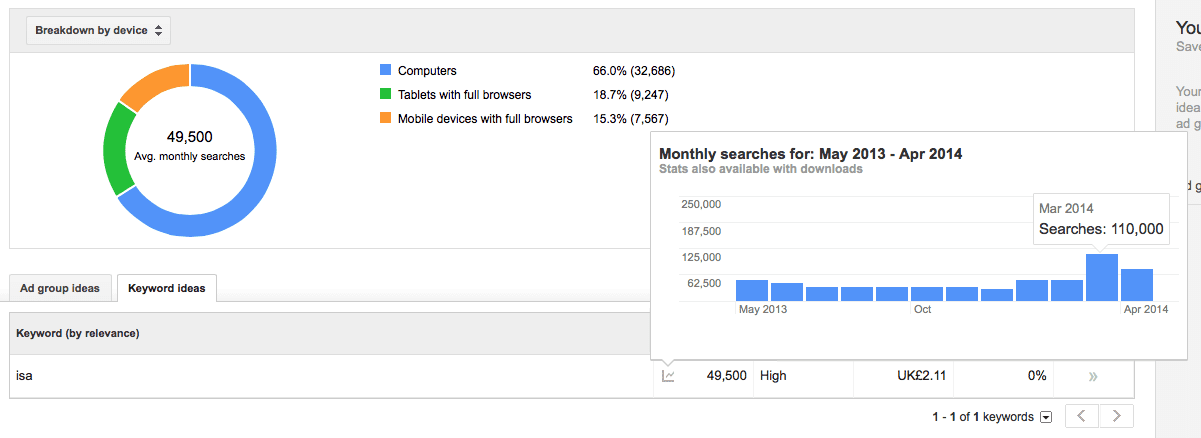
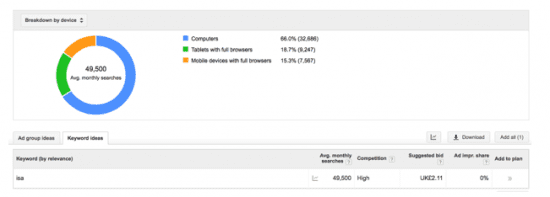 Alternatively, you can also analyse individual keywords to determine specifically how each of them is performing by device type. In the first image above, we could see that [isa] was driving 49,500 searches per month as part of the aggregate list, however we can also see how these 49,500 [isa] searches themselves are broken down by device type in the second image.
This is useful for understanding how keyword groups differ from one another and whether individual content sections or landing pages might need to be tailored for those searching on desktop, mobile or tablet computers.
Analysing mobile trends over time
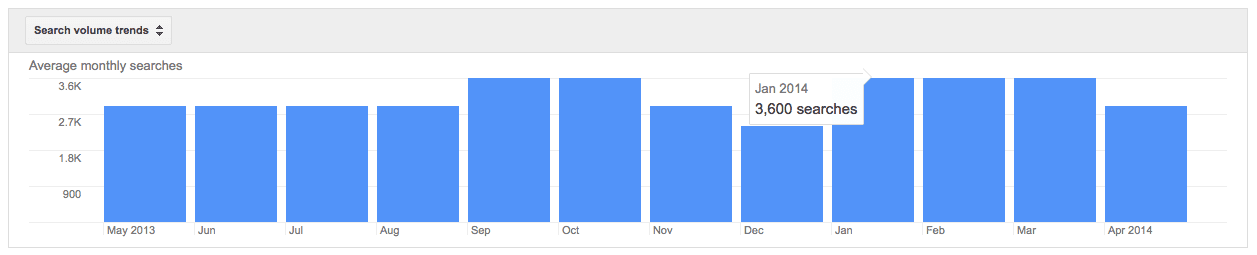
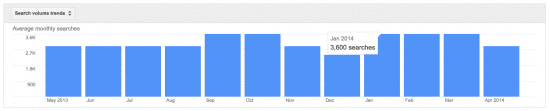
In addition to looking at overall search volume trends over time for particular keywords, e.g.:
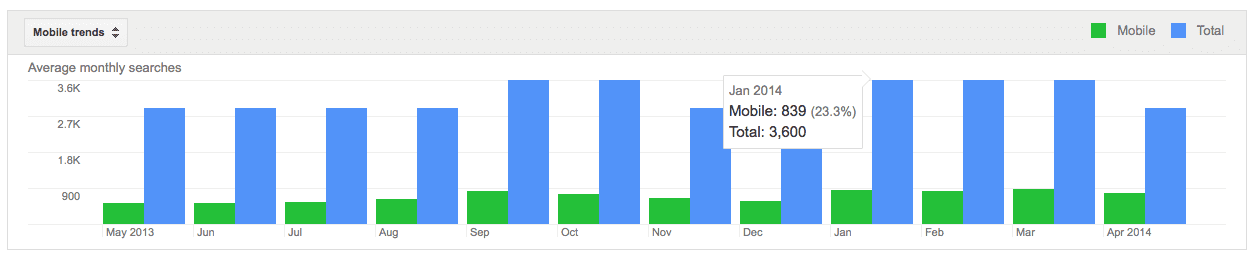
... the Keyword Planner also allows users to see the mobile percentage of these search terms over a period of time:

This is particularly useful to see how consumer behaviour is changing in relation to how people are using mobile devices to search online:
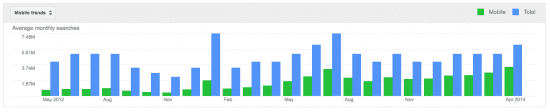
For the term [weather] (used above), one can clearly see that the percentage of searches conducted on mobile devices has increased steadily over time, from 17.3% in May 2012 to 56.1% in April 2014.
Along with the contribution of search volume for keywords by device which we looked at in the previous section, this level of data allows marketers to look at how content is rendered on different devices, for either a particular search term or group of terms, and can inform how content can be tailored to create a more useful user experience across devices.
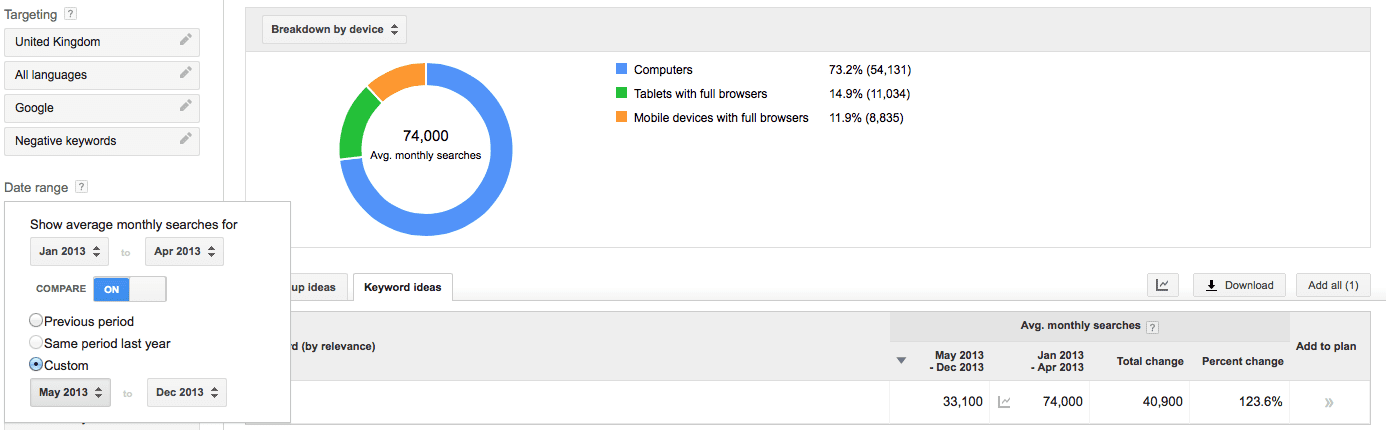
Get more accurate data by setting specific dates
In the example above, we looked at the term [isa]. The 49,500 searches per month is an average taken over the last 12 months. For other terms that are not as highly affected by seasonality (e.g. [bank accounts]), this annual average number is still quite useful.
However, because an ISA is a very seasonal financial product, it’s worth considering how search volume and demand for this term varies over the course of the year:
 The seasonal snapshot above shows that there’s a clear escalation in search volume for the term [isa] from January onwards, with a peak in March. It might therefore be worth looking at the average search volume for this term during both ‘ISA season’ (January - April) and the rest of the year:
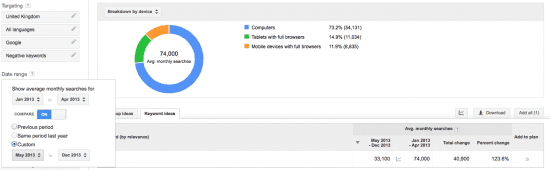
By selecting the dates we want to focus on using the ‘date range’ selector in the left-hand navigation, we can compare average monthly searches for two specific date ranges to see how they differ.
As you’ll see from the data above, the graph provides absolute and relative changes so we can see that there is nearly a +124% percentage change in searches for the term [isa] during ‘ISA season’ vs. the rest of the year. Armed with this information, content, SEO and paid search efforts can be prioritised during key times of the year in order to maximise the seasonal opportunities.
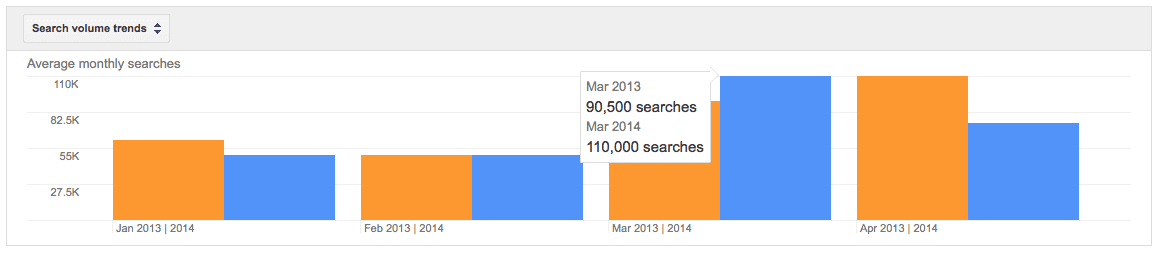
Another handy aspect of the date range feature is the ability to compare search volume year-on-year so that accurate comparisons can be made for search demand:

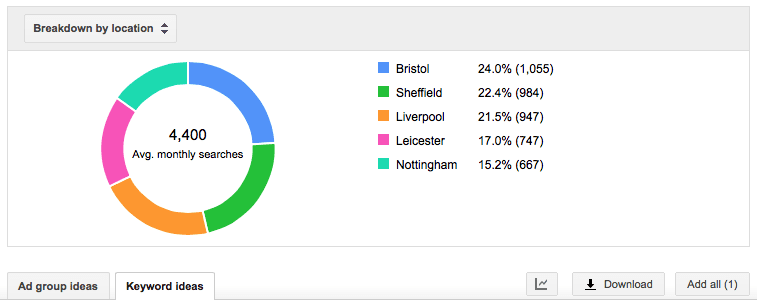
Understand how search trends differ by target locations
Another useful addition to the Keyword Planner is the ability to see a breakdown of search volumes by location:
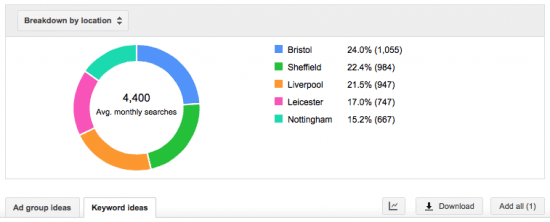
This feature allows marketers to analyse the differences in search volume by location and identify segmentation opportunities. For example, although Nottingham is the second largest city by population size from the sample used above, it’s driving the least number of searches. Perhaps there is an opportunity to improve content and messaging on the website or modify bids in paid search campaigns in relation to Nottingham.