Our compilation of the latest social media statistics of consumer adoption and usage of social networking platforms
Social networks have transformed marketing and, as this post shows, their popularity is still growing in our latest global social media statistics research summary for 2025.
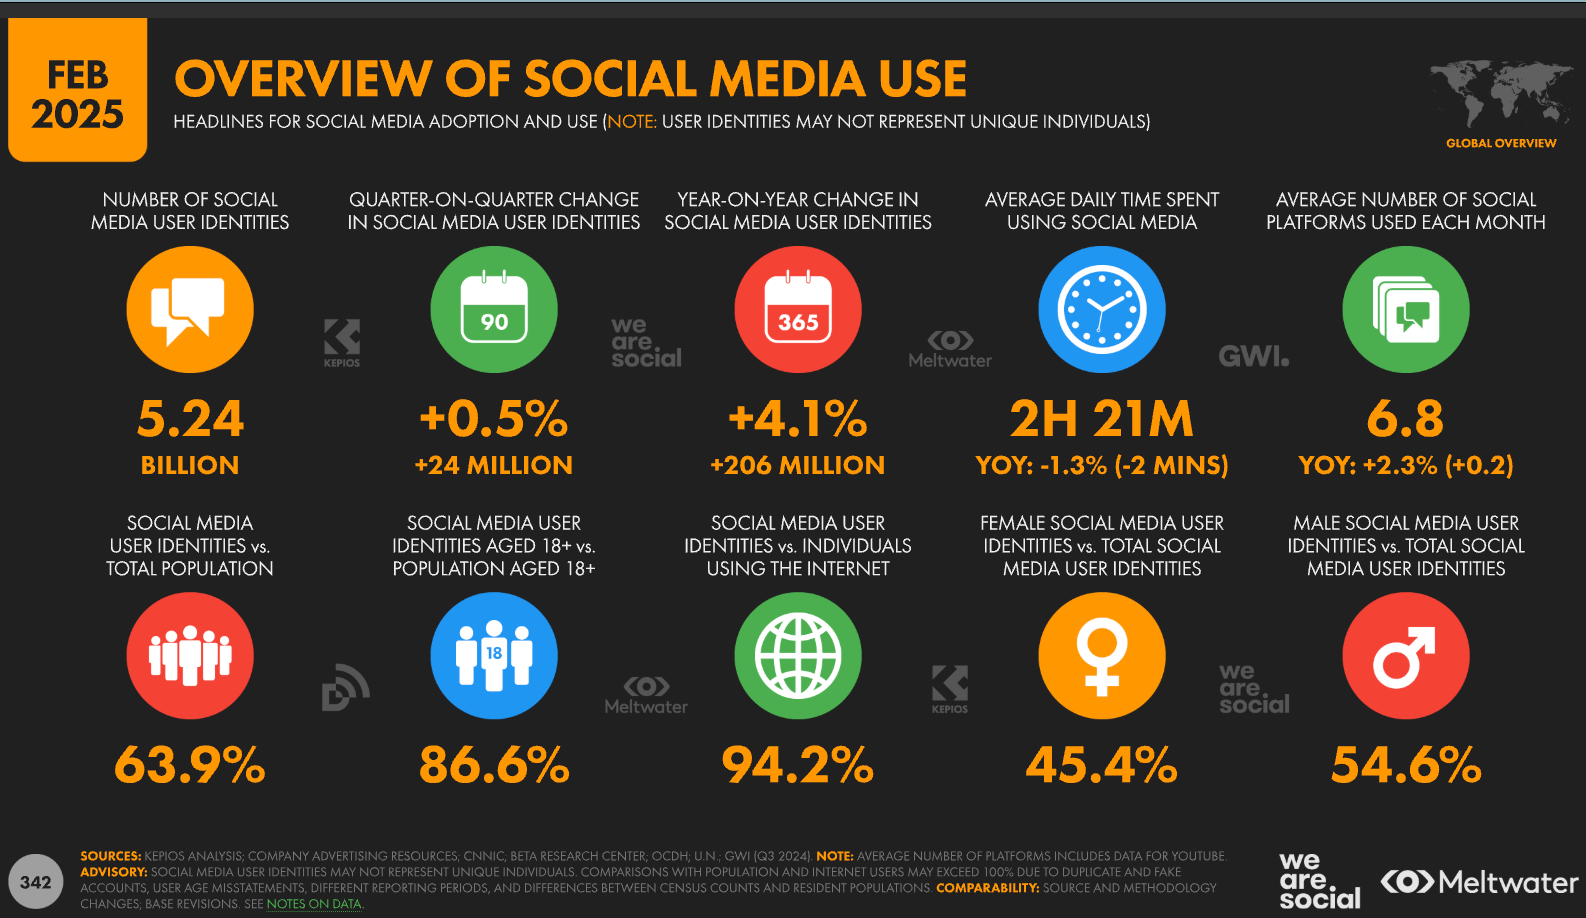
Research by Global WebIndex that we reference in this article shows that globally,
63.9% of the world's population uses social media. The average daily usage is 2 hours and 21minutes (February 2025).
Since it's the start of the year, we have included the most recent research from the end of the previous year, but will update this compilation of research through 2025. We include the lastest figures for the fast growing social networks such as Threads and Bluesky which has recently announced dramatic growth as many people switch from X / Twitter.
We'll keep this post updated during 2024 as the latest statistics are published drawing on our recommended top 10 digital marketing statistics sources. We'll be pointing to new data on the popularity of social media from Global Web Index (worldwide), Pew Internet Surveys (US) and OfCom (UK), and, most recently, the Datareportal global digital overview with the latest 2025 review published in February showing the headline statistics of social media usage:
This post will apply the latest reports to our answers in 7 key areas crucial to understanding consumer use of social networks:
- Q1. What is the overall popularity of social media compared to internet use globally?
- Q2. Which are the most popular social networks by demographics (age and gender)?
- Q3. Which are the fastest-growing social networks?
- Q4. How do social users interact with brands when selecting products and services?
- Q5. What are the different engagement metrics based on consumer behavior when using social media?
- Q6. How do consumers interact with different post formats in social media?
- Q7. What are the most popular times for consumers to use social media suggesting the best times to post?
Now more than ever, marketers need to make smart decisions when planning their digital distribution channels. So reviewing the latest social media diffusion and usage stats is a crucial part of any company's digital marketing strategy.
Q1. What is the overall popularity of social media compared to internet use globally?
Datareportal regularly updates its global compendium of social media statistics, which we recommend as it gives some great insights into the world of social media. It's a great download for including slides for your presentations. Note that their data is compiled from other sources of which the Global Web Index panel is the best source, although only available to paid subscribers. If you're researching social network adoption, it's worth checking out GWI's top 10 social media statistics and their free annual report of social media trends.
How many people use social media?
According to the Datareportal April global overview, we can see that social media growth has continued to increase:
- More than half of the world now uses social media (62.6%)
- 5.07 billion people around the world now use social media, 259 million new users have come online within the last year.
- The average daily time spent using social media is 2h 20m.
The full report from Datareportal contains insights collated from different data providers across 200+ slides. It provides country-specific data for the vast majority of the world, so you might want to check out the slides of the countries in your core markets to get a better idea of the current state of social in the areas you operate. In this post, we focus on the social media data which starts at slide 205 in the report.
Q2. Which are the most popular social networks by demographics (age and gender)?
One source for getting stats on the biggest social media platforms is direct from company statements and earning announcements. However, these can be misleading based on different definition of 'active users'. So, a panel source such as GWI here reported via DataReportal gives a better comparison.
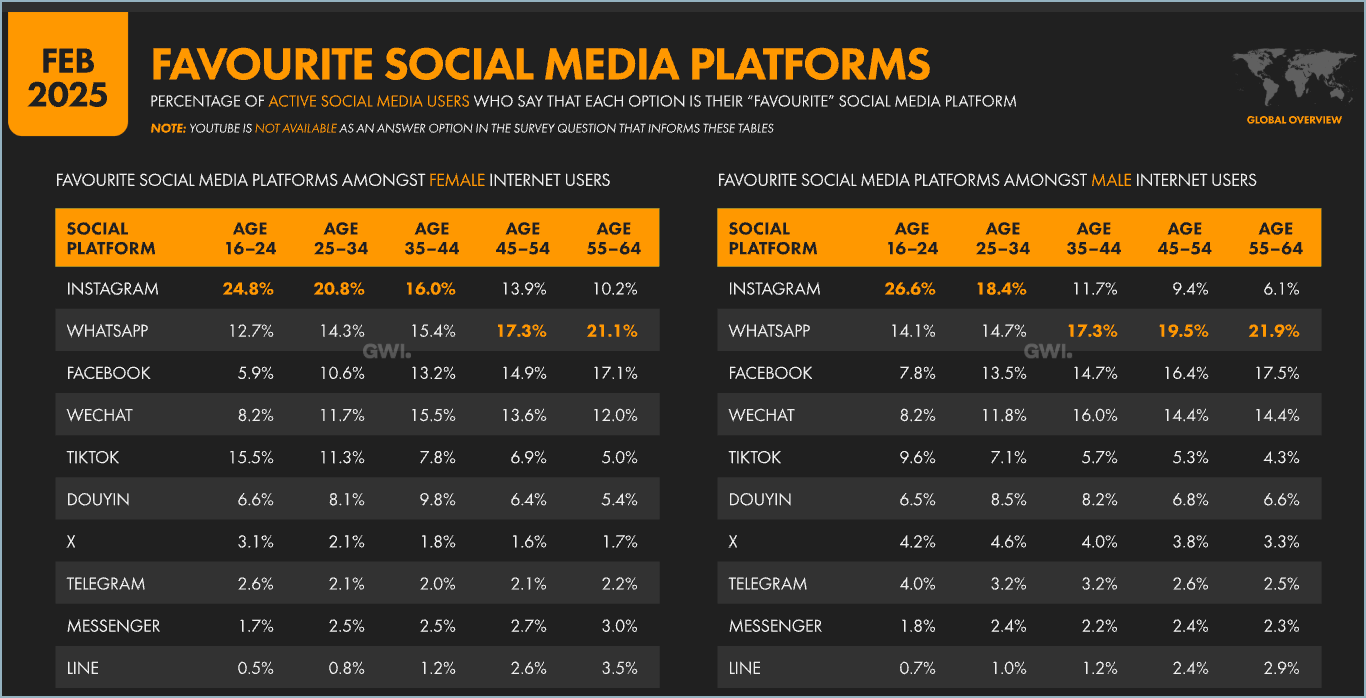
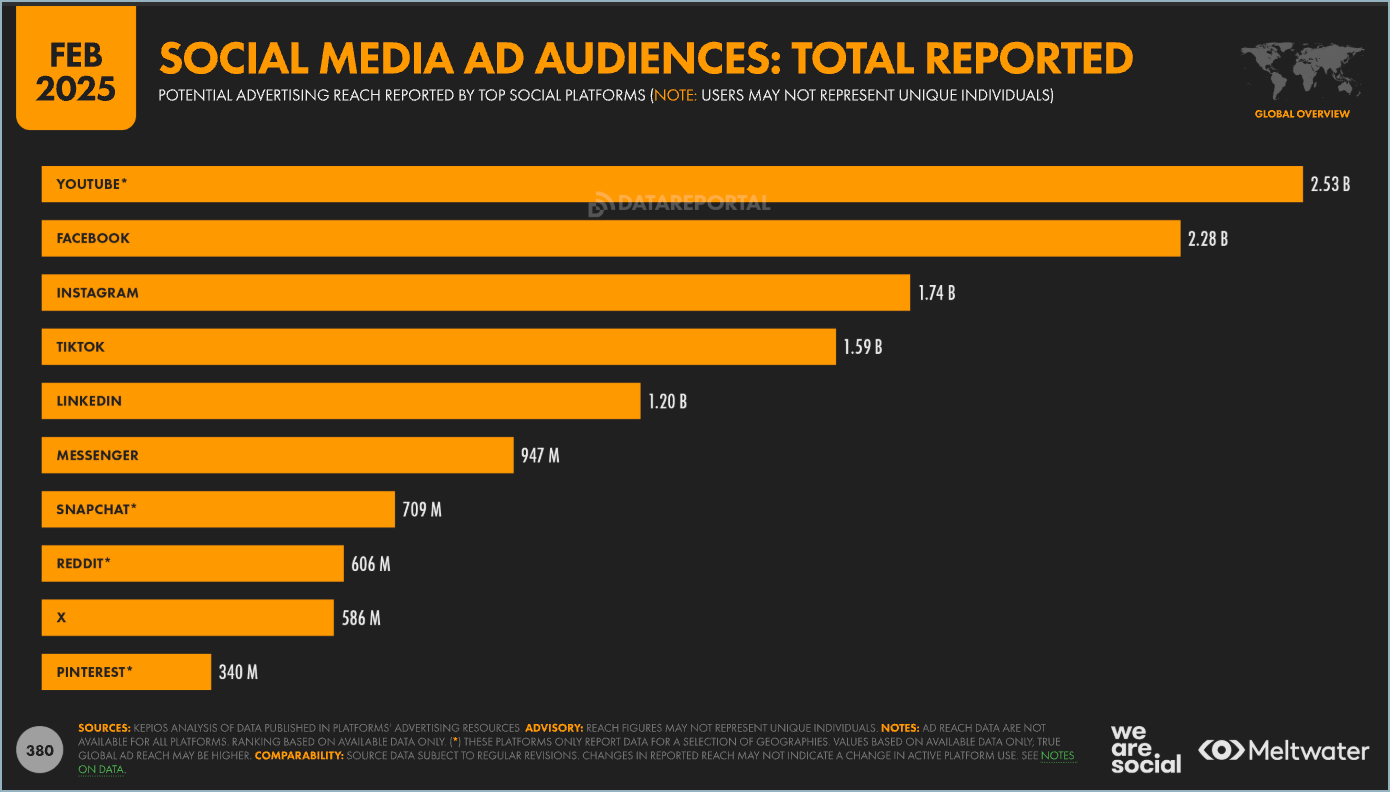
As an alternative, this is the most recent compilation of active users for the main social networks as we enter 2025.
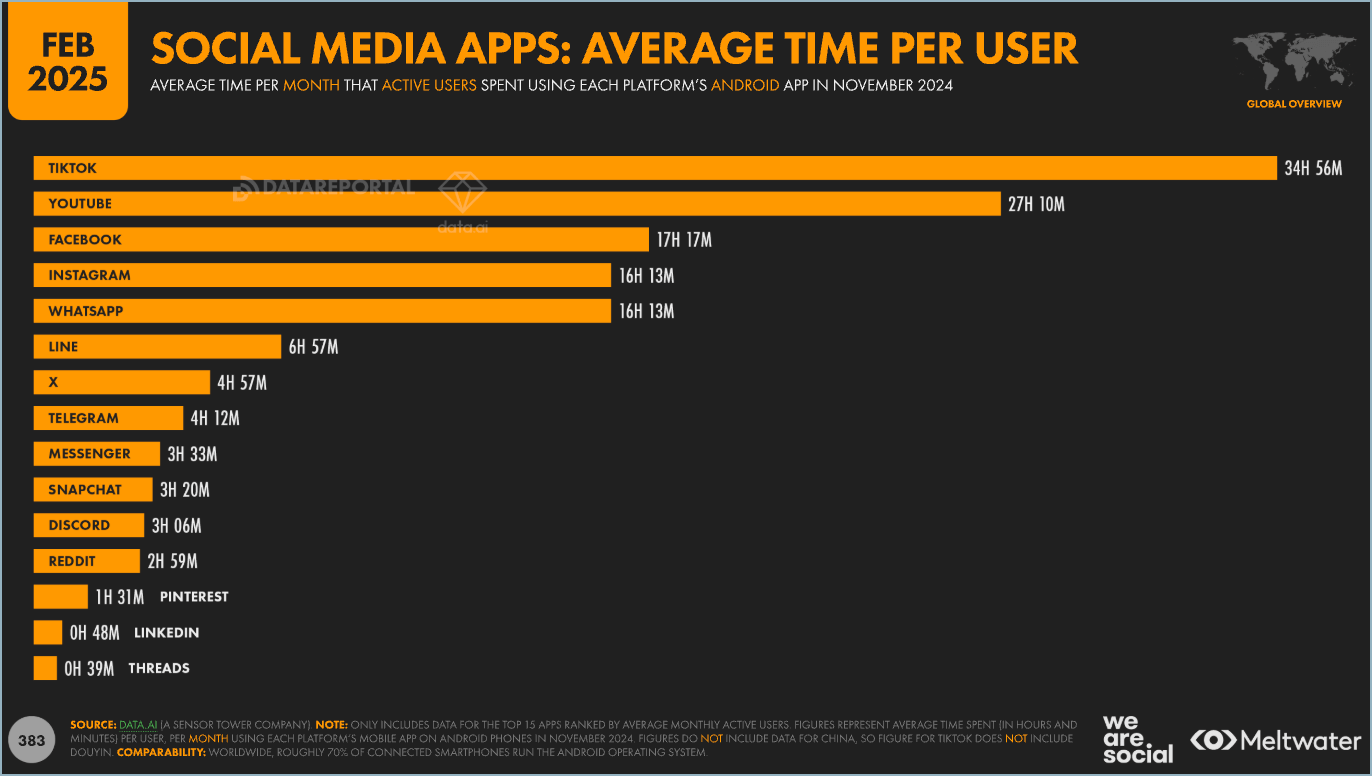
Mobile app usage gives another benchmark for the most popular social networks. Considering average time per user, YouTube and TikTok are most popular overall.
So, what does this mean for your social media marketing strategy?
Clearly, there are lots of opportunities to reach, interact with, convert, and engage social media users. Savvy marketers use social media across their marketing funnel, to influence journeys from product discovery, through to first purchases, loyalty, and advocacy.
Our RACE Framework has a data-driven structure that marketers can use to plan their own strategies.
Free digital marketing plan template
Our popular marketing planning template is structured across the Smart Insights RACE Framework. Join Smart Insights as a Free Member to download our digital marketing plan template today
Access the Free digital marketing plan template
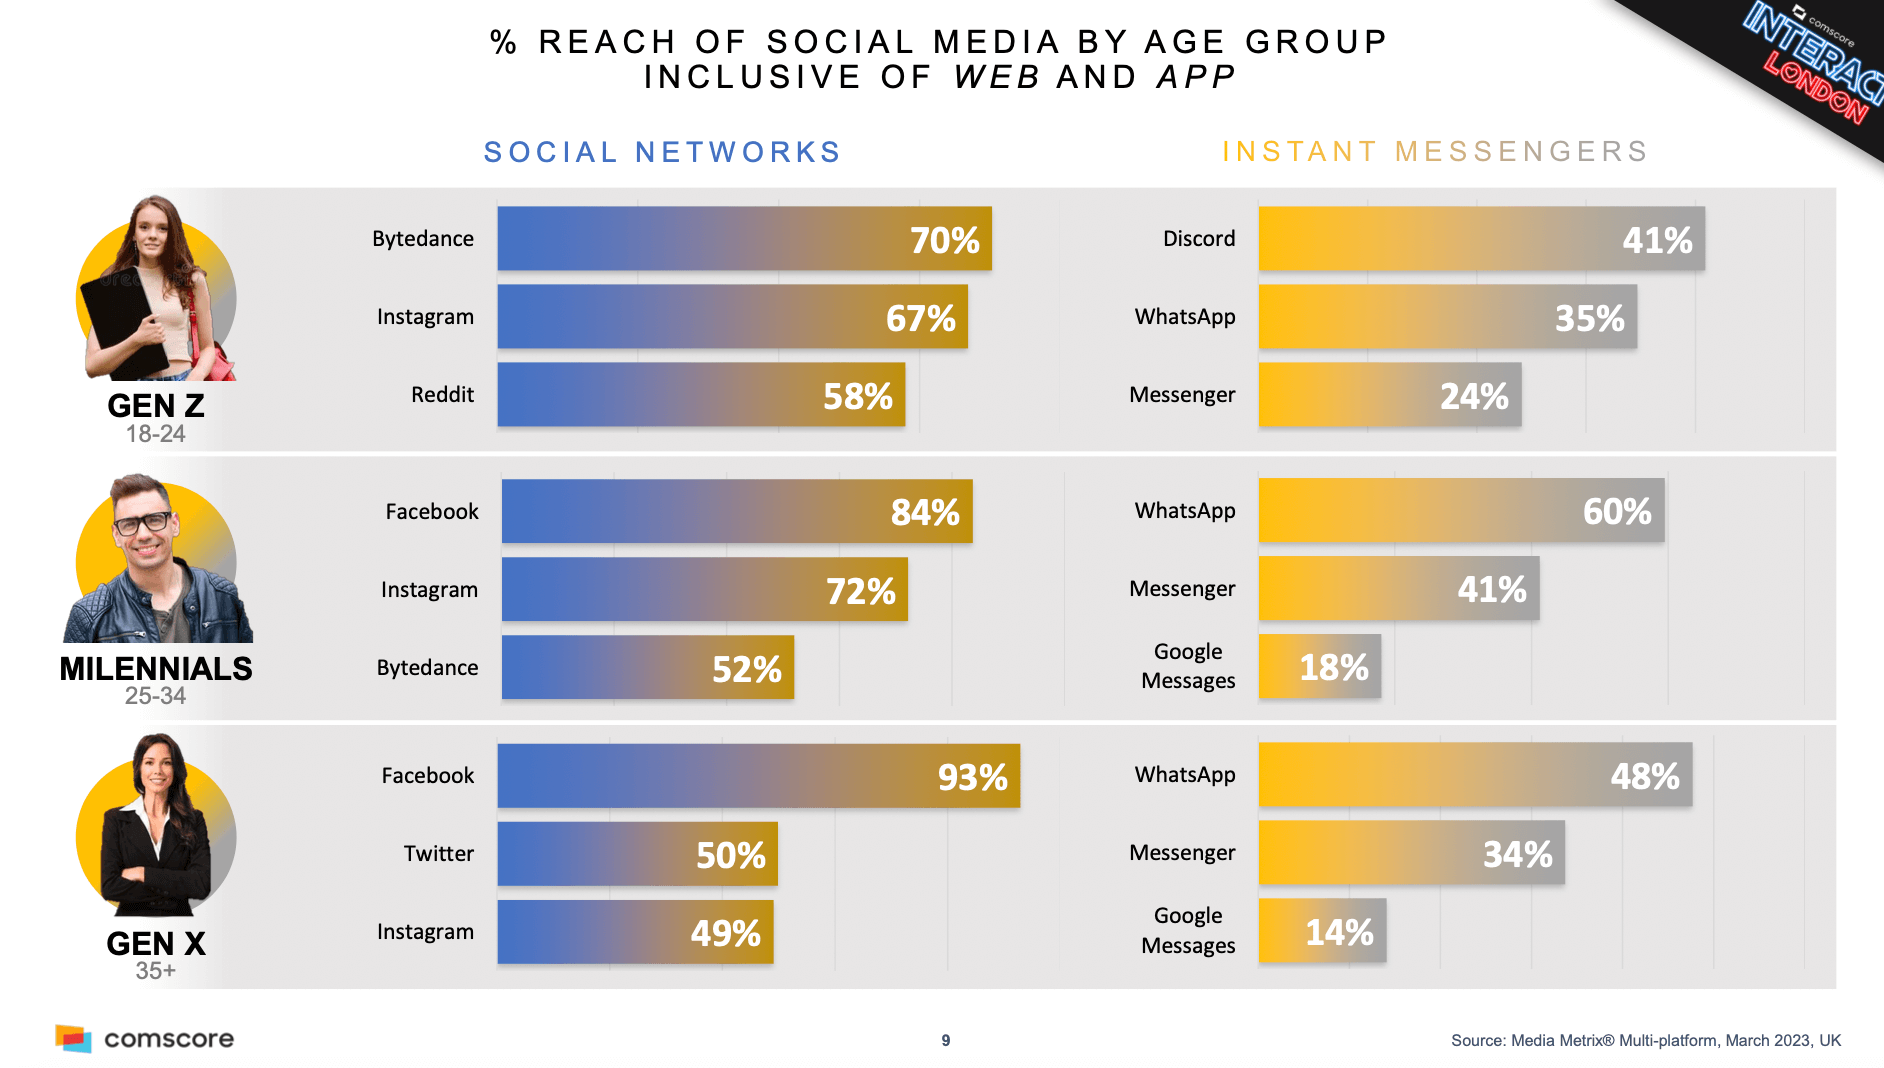
Popularity of social networks and instant messengers in the UK for different demographics
This less recent data from Comscore focused on the UK for Gen Z, Milennial and Gen X groups shows the wide variation in usage of social apps in the UK. In the younger age group Reddit and Discord are surprisingly important, in part because of Gaming. Facebook remains dominant in older age groups.
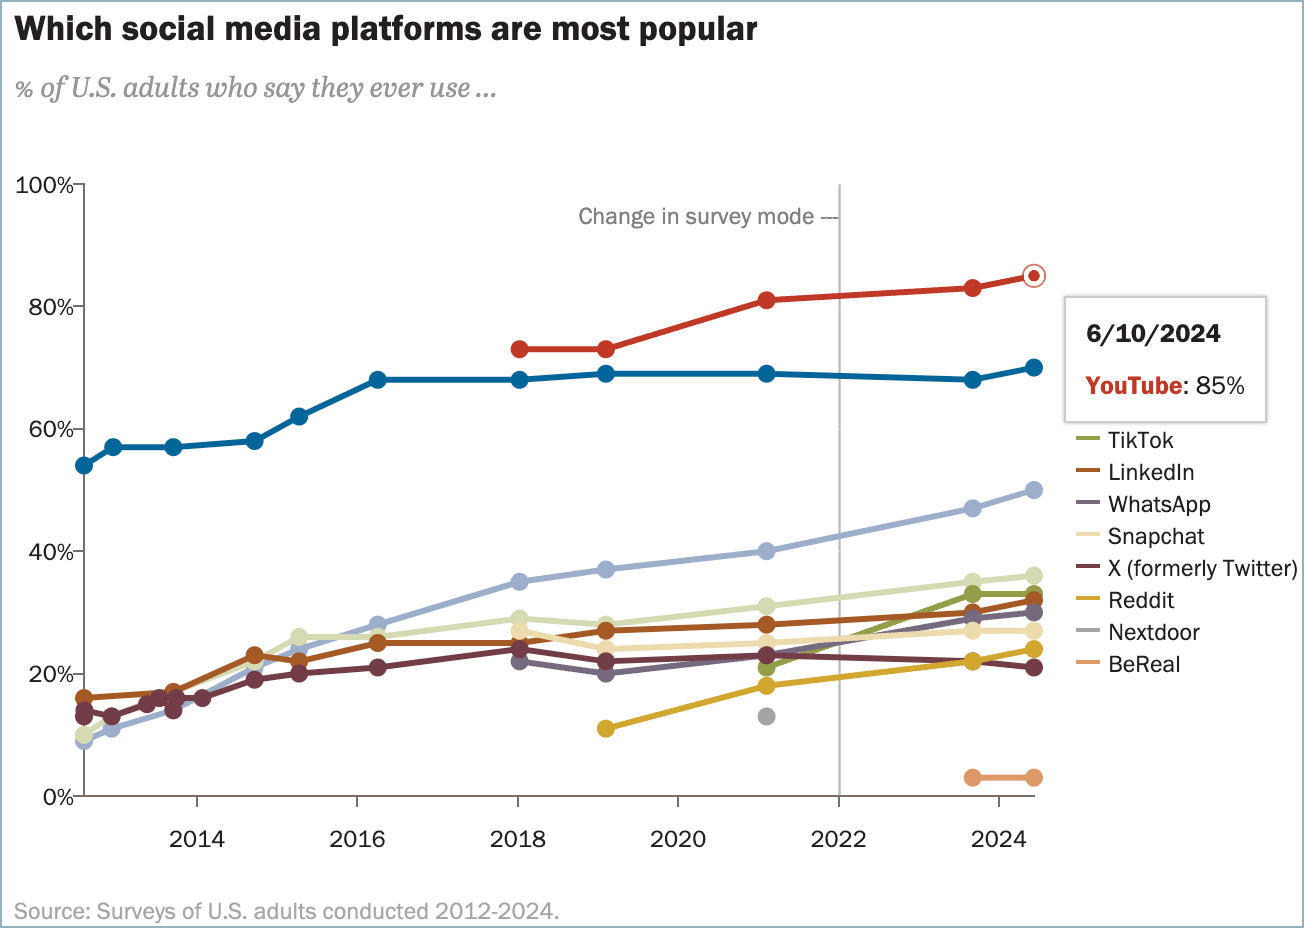
United States Social network popularity
The Pew Research Center news usage research is a useful recent source showing US social media statistics and trends.
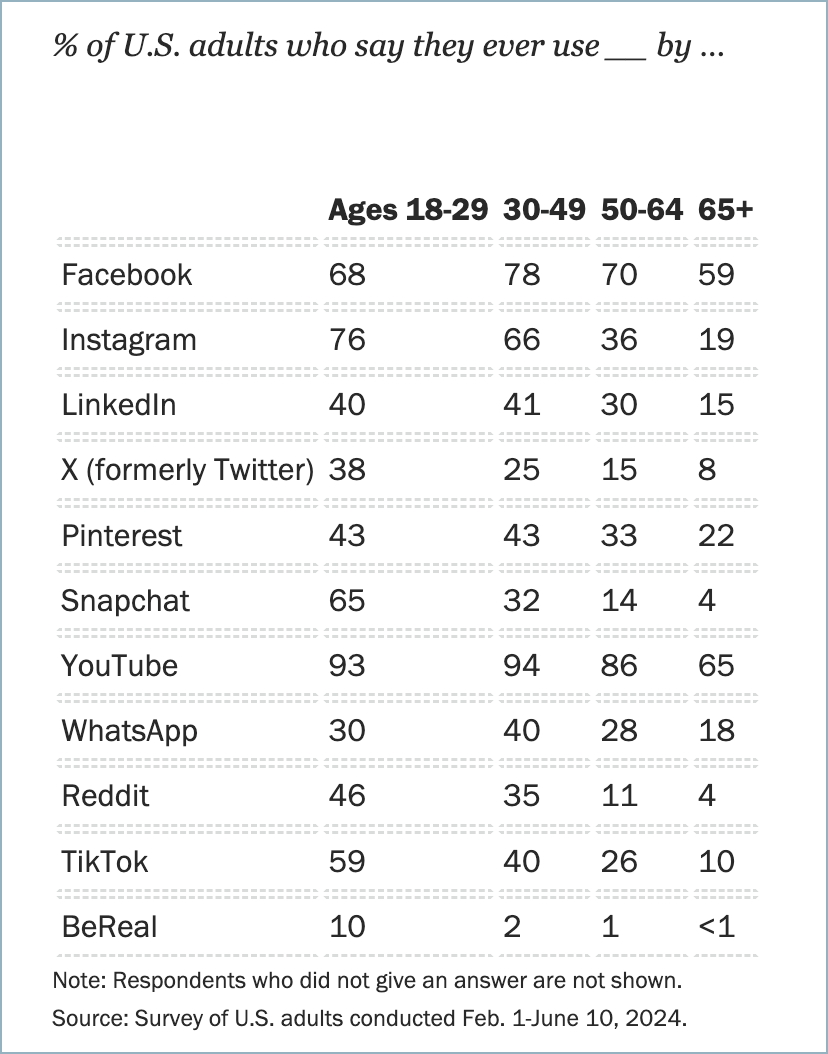
Pew also give Age and Gender breakdown, for example:
Q3. Which are the fast-growing social networks?
Every marketer has limited time for social media marketing, so which fastest-growing social network should you focus your efforts on?
Oberlo has a good summary of the Fastest growing social networks
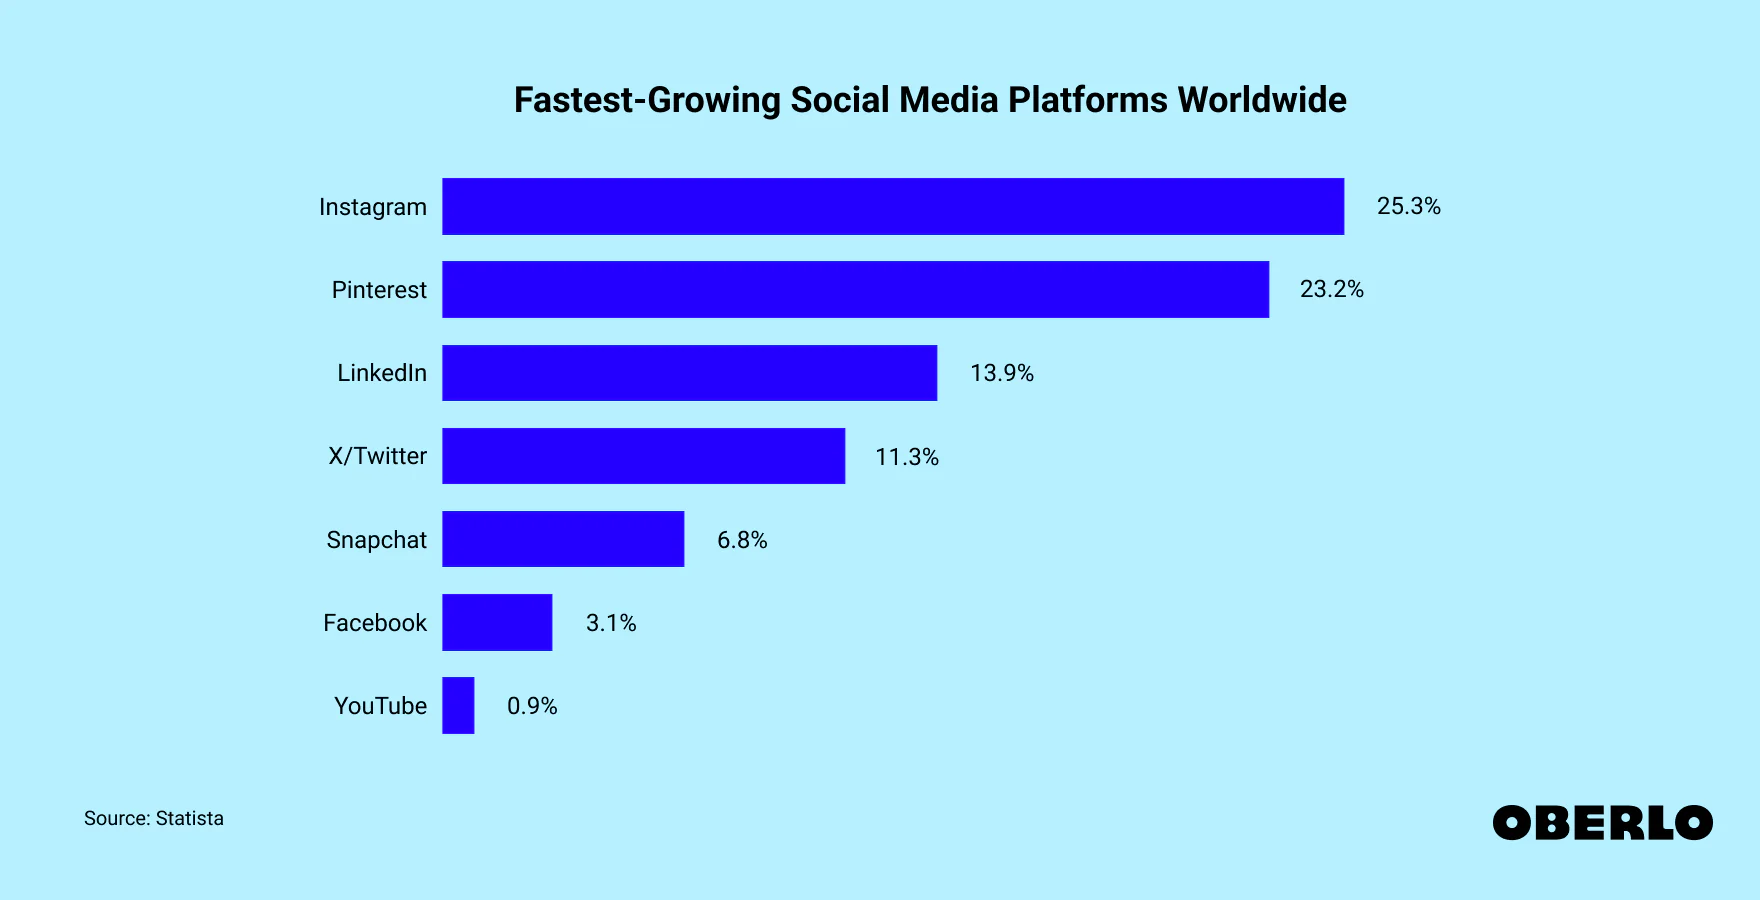
However, these don't include less well established networks such as Bluesky and Threads (from Meta).
Bluesky, a decentralized social media platform, has introduced trending topics to enhance user engagement. This feature enables users to discover and participate in popular discussions, similar to functionalities on other platforms. Bluesky's also announced that its user base has grown to over 25 million, reflecting its increasing popularity among individuals and organizations seeking alternatives to traditional social networks including X and Meta's Threads, which was developed as a Twitter/X example.
Note that although Bluesky has a high growth rate, growing from 13 million total users in October, to 20 million by mid-November and 26 million by the start of 2025, the number of unique active users has not been released and is likely significantly smaller than Threads which now has 300 million active users.
View source for more details
Q4. How do social users interact with brands when selecting products and services?
One of the challenges of social media marketing is that by its nature, social media are peer-to-peer, involving conversations between friends, families and colleagues. Given this, brands must be sensitive to how they use social media.
Insight from GWI shows the important role that social media plays in influencing brand discovery and in encouraging purchase. This insight shows the relative importance of ads, recommendations and updates to business social media pages in brand discovery.
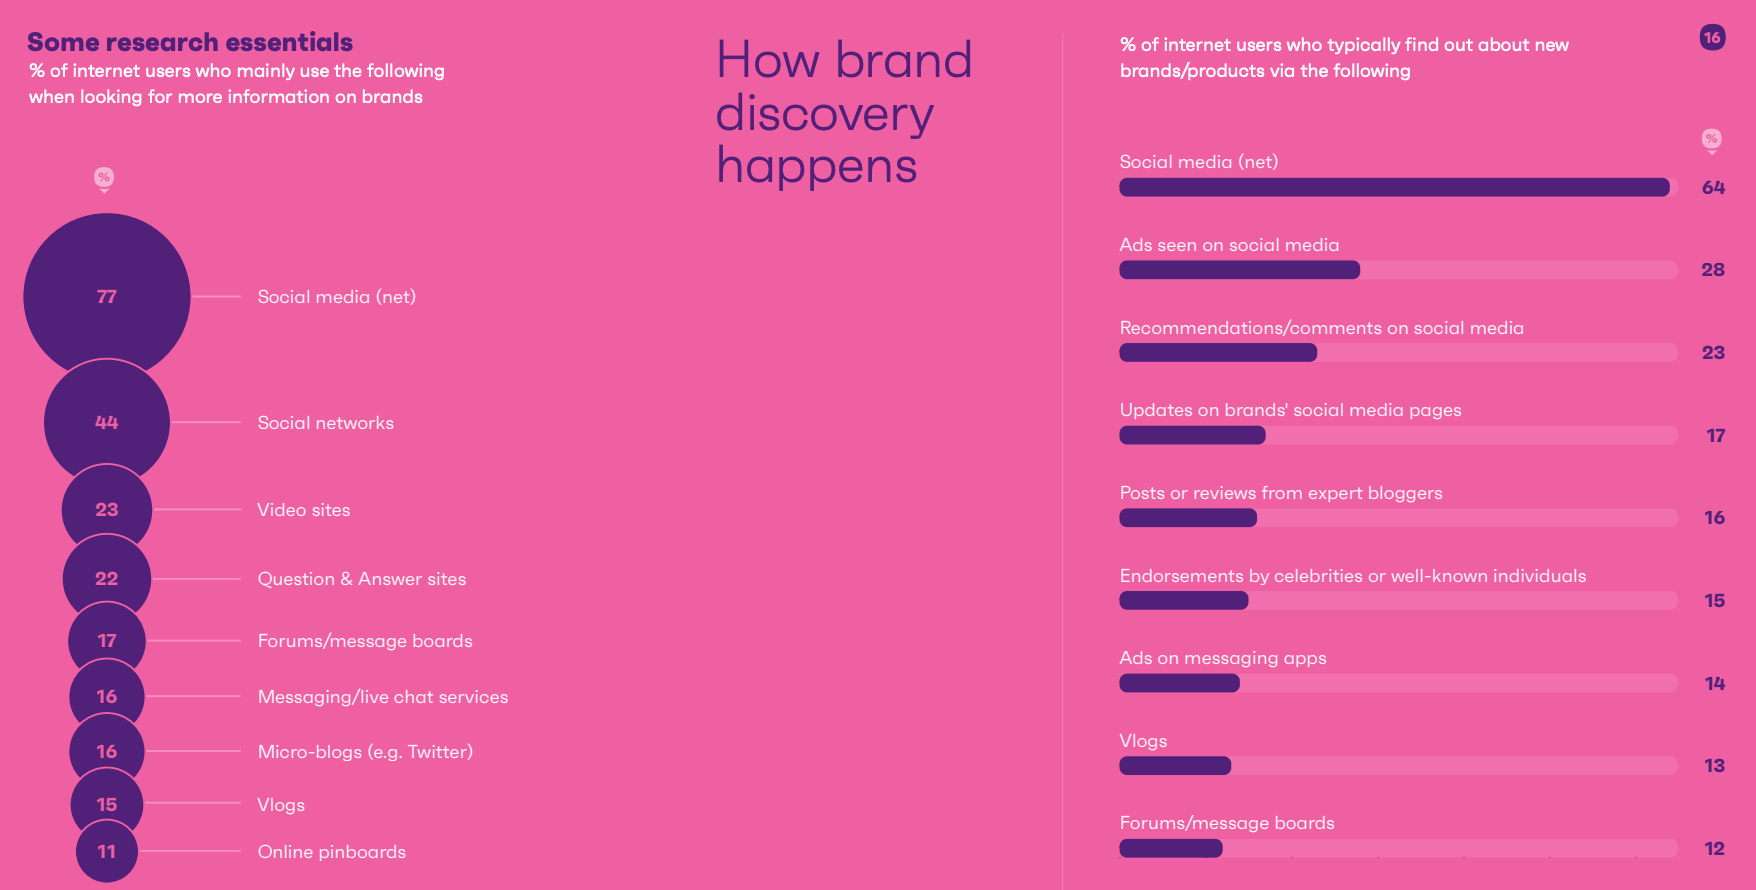
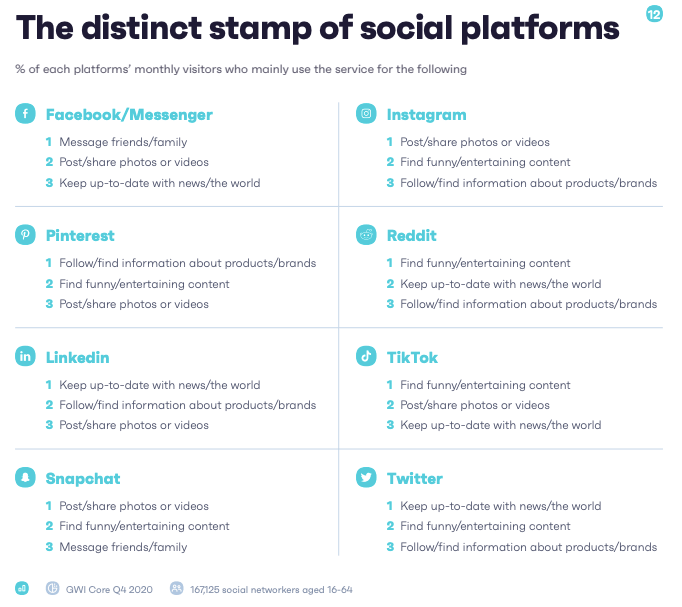
The research from GlobalWebIndex also shows how/why visitors use different social media services. Instagram, Pinterest, Linkedin, Reddit and Twitter users all report 'follow/find information about products/brands' in their top 3 motivations.
Q5. What are the best benchmarks for different platforms' engagement rates?
Social media statistics benchmarking tool Rival IQ produces these useful sector-by-sector benchmarks of social media engagement metrics including:
- Posts per day
- Posts per week
- Engagement rate
- Top hashtags by engagement rate
These include useful sector benchmarks for Facebook, Instagram, and Twitter you can compare against. Here is a sample of the insights from their 2022 report.
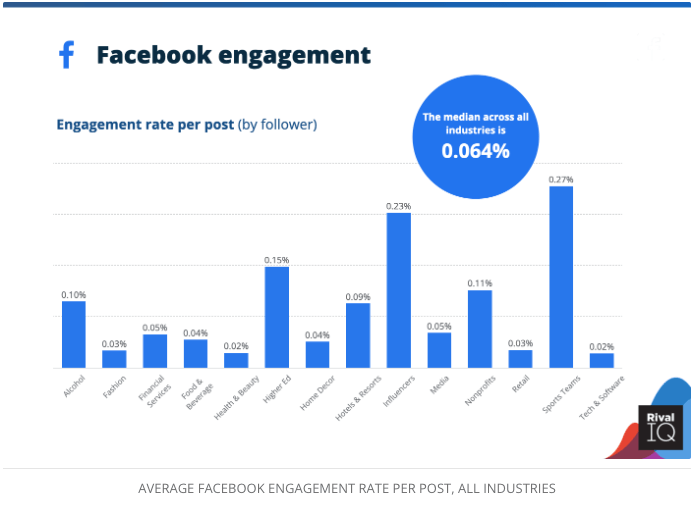
Facebook engagement rates
At the lower end of the spectrum, Health & Beauty, and Tech & Software receive an average 0.02% engagement rate.
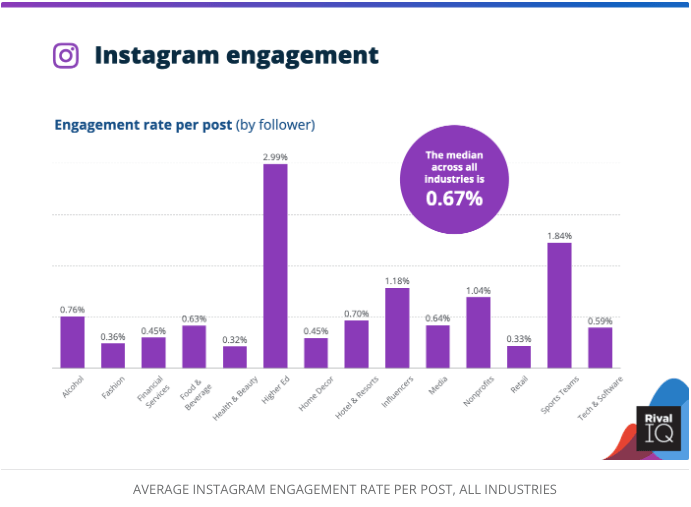
Instagram engagement rates
Engagement rates are significantly higher on Instagram compared to Facebook.
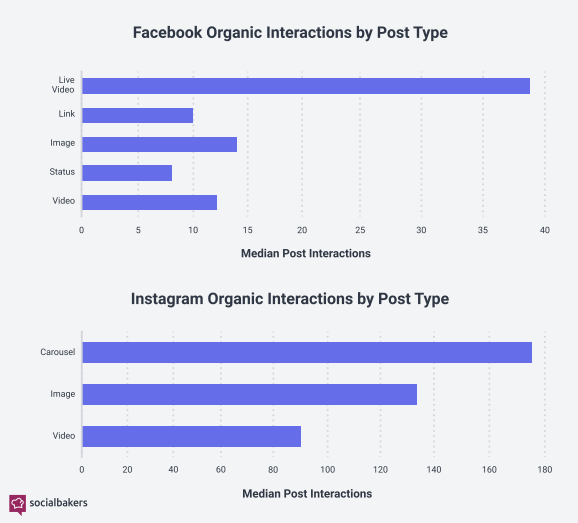
Q6. How do consumers interact with different post formats in social media?
Marketers know intuitively that the right type of visuals and videos are more effective in gaining engagement.
This is supported by observed interaction rates. According to LinkedIn, Images typically result in a 2x higher comment rate and Video gets 5x more engagement on LinkedIn, Live Video gets 24x more.
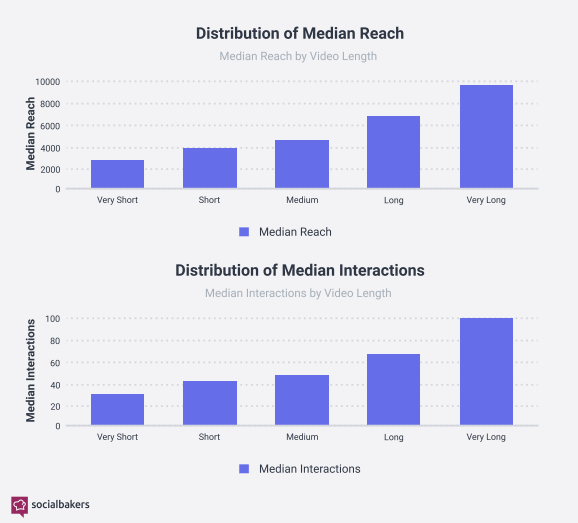
This is also supported by this data from this Social Bakers social media trends report:
Videos longer than a minute achieved the highest median interactions and median reach on Facebook, according to Socialbakers data.
In fact, for both reach and interactions, there was a correlation that showed the longer a video was, the further it reached and the more interactions it received.
Socialbakers’ metrics for video length are very short (less than 11.882 seconds), short (more than 11.882 and less than 24.362 seconds), medium (more than 24.362 and less than 61.248 seconds), long (more than 61.248 seconds and less than five minutes), and very long (more than five minutes).
As you can see, different platforms offer different opportunities for capturing different audiences. The trick is finding the right techniques to that to your channel goals.
If you're looking for one simple reference guide which contains all the social media channel updates in an easy-to-track format, look no further than our digital media updates tracker, which is updated quarterly, to make sure our Business Members never miss a trick.
Q7. What are the most popular times for consumers to use social media suggesting the best times to post?
Testing different frequencies of updates and timing is another aspect of social media optimization based on consumer behaviour.
Each network tends to have a ‘sweet spot’ for frequency based on its algorithms. It used to be beneficial to post several times a day on Facebook for many brands, but with decreased organic reach, a single update tends to be more effective. We find a higher frequency on LinkedIn or Twitter tends to be more effective.
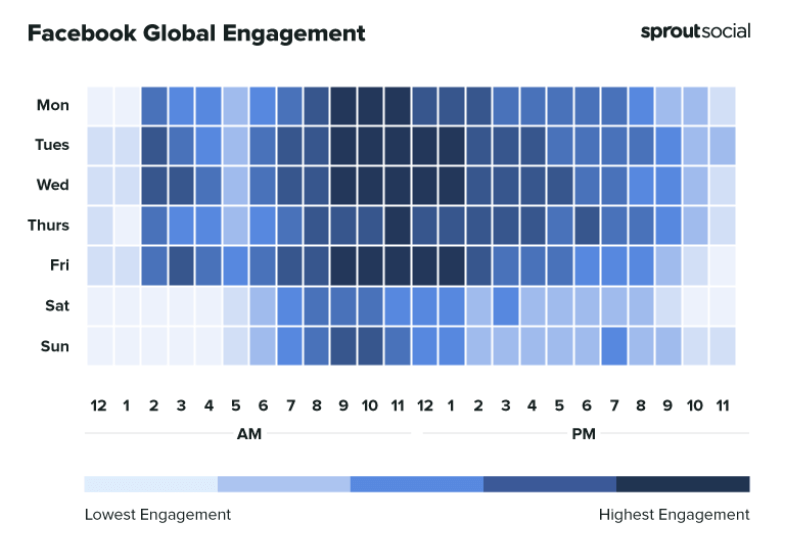
Sprout Social's 2022 social media strategy builder compares the best times to post on social media. Compare these to your patterns of posting and consider how you could post differently.
Each network tends to have a ‘sweet spot’ for frequency based on their algorithm and the most common times for consumer usage. It used to be beneficial to post several times a day on Facebook for many brands, but with decreased organic reach, a single update tends to be more effective.
We find a higher frequency on LinkedIn or Twitter tends to be more effective. The results from Instagram and Facebook show a clear preference for around midweek at midday, so you should consider this when scheduling your post updates.
Structure your marketing plan around a funnel proven to boost performance. Join Smart Insights as a Free Member for instant access to our free digital marketing plan template to hone your skills and drive the results you need.
Free digital marketing plan template
Our popular marketing planning template is structured across the Smart Insights RACE Framework. Join Smart Insights as a Free Member to download our digital marketing plan template today
Access the Free digital marketing plan template