Our compilation of average email open rates and click-through rate data. What's a good open rate for email? Review our recommended statistics sources to benchmark your email campaigns for your industry sector
When I run training workshops on Email marketing, Email marketers often ask "how do our campaigns compare"? They're looking for email statistics to compare subscriber engagement for average email open rate, clickthrough, delivery, unsubscribe and complaints rates, ideally within their sector. That's what we cover in this regularly updated compilation of the best email marketing response statistics for different sectors and countries.
Fortunately, there are several good options to benchmark email response across different sectors. The best stats sources are compilations by email marketing service providers who produce statistics across their clients' campaigns. We have grouped the stats into the top eight questions asked including:
For the most meaningful comparisons, we need to go beyond industry averages and drill down to the comparison of email types. For example, transactional emails such as a welcome sequence tend to have much higher interaction and click-through rates than a regular newsletter.
The benchmark statistics on email response vary depending on the types of email platform vendor used to send email. Lower-cost platforms tend to have SMB customers who are less well-known brands and this will mean that they have a different response from higher-cost enterprise email platforms which are better-known brands.
Email statistics - January 2024 update
We will continue to update these stats through 2024 as new reports are produced by the main email platforms which we link to show the latest open rates and clickthrough rates.
We have a wide range of tools and templates for marketers looking to make data-driven marketing decisions. Whether you're looking for channel excellence or marketing strategy advice, we've got resources to support your digital marketing optimization journey.

Q1. What are the email open and clickthrough rates by industry?
In this section, we present email engagement statistics from larger, global email marketing providers which tend to be the most accurate for industry sectors. For countries you are interested in, use these to find the details. Recommended sources are:
A. Constant Contact
This table, from data for B2B and B2C businesses published in January 2024 by Constant Contact, gives the average email open and clickthrough rates by industry. The overall average open rate is 39.7%, with a 1.0% CTR - how do your email engagement rates compare?
| Business Type | Open Rate (%) | Clickthrough Rate (Clicks/Delivered) | Bounce rate (%) |
| All Industries – Overall Average | 36.5% | 1.4% | 10.4% |
| Administrative & Business Support Services (billing, phone answering, hiring, etc.) | 31.1% | 1.8% | 11.2% |
| Child Care Services | 44.8% | 1.7% | 10.0% |
| Consulting Services (management, marketing, advertising, blogging) | 30.1% | 1.4% | 9.8% |
| Dining and Food Services | 37.6% | 0.7% | 9.0% |
| Education | 40.2% | 1.7% | 9.7% |
| Faith-Based Organizations | 45.5% | 2.5% | 9.6% |
| Family and Social Services (government, adoption, pet care, elderly care, etc.) | 42.7% | 2.1% | 10.5% |
| Financial Services (accounting services, bookkeeping, advisor, insurance and brokerage, etc) | 30.4% | 1.0% | 9.8% |
| Health and Wellness (physicians, home care, dentists, mental care, nutrition, etc.) | 37.0% | 1.0% | 10.2% |
| Home & Building Services (cleaning, landscaping, contractors, construction, etc.) | 39.3% | 1.3% | 10.1% |
| Independent Artists, Writers, and Performers | 41.4% | 1.4% | 8.5% |
| Legal Services | 33.2% | 1.6% | 14.3% |
| Manufacturing and Distribution | 30.1% | 1.3% | 14.3% |
| Nonprofit Membership Organizations | 42.3% | 1.9% | 12.0% |
| Nonprofit Services | 41.8% | 1.9% | 11.2% |
| Personal Care Services (nail, hair, skin, nutrition, fitness, etc) | 36.4% | 0.7% | 11.2% |
| Real Estate | 35.0% | 0.9% | 13.4% |
| Recreation, Sports & Entertainment (Yoga studio, bowling alley, etc) | 41.8% | 1.1% | 10.1% |
| Repair and Maintenance | 29.4% | 0.7% | 4.9% |
| Retail (Brick and Mortar & Online, wholesale and direct selling) | 33.1% | 0.9% | 7.7% |
| Technology Services | 20.8% | 2.6% | 10.7% |
| Transportation Services (trucking, warehousing, logistics) | 20.8% | 2.6% | 10.7% |
| Travel & Tourism (passenger transport, accommodations, travel agencies, etc.) | 36.2% | 1.0% | 14.4% |
| Average | 39.7% | 1.0% | 8.4% |
B. GetResponse
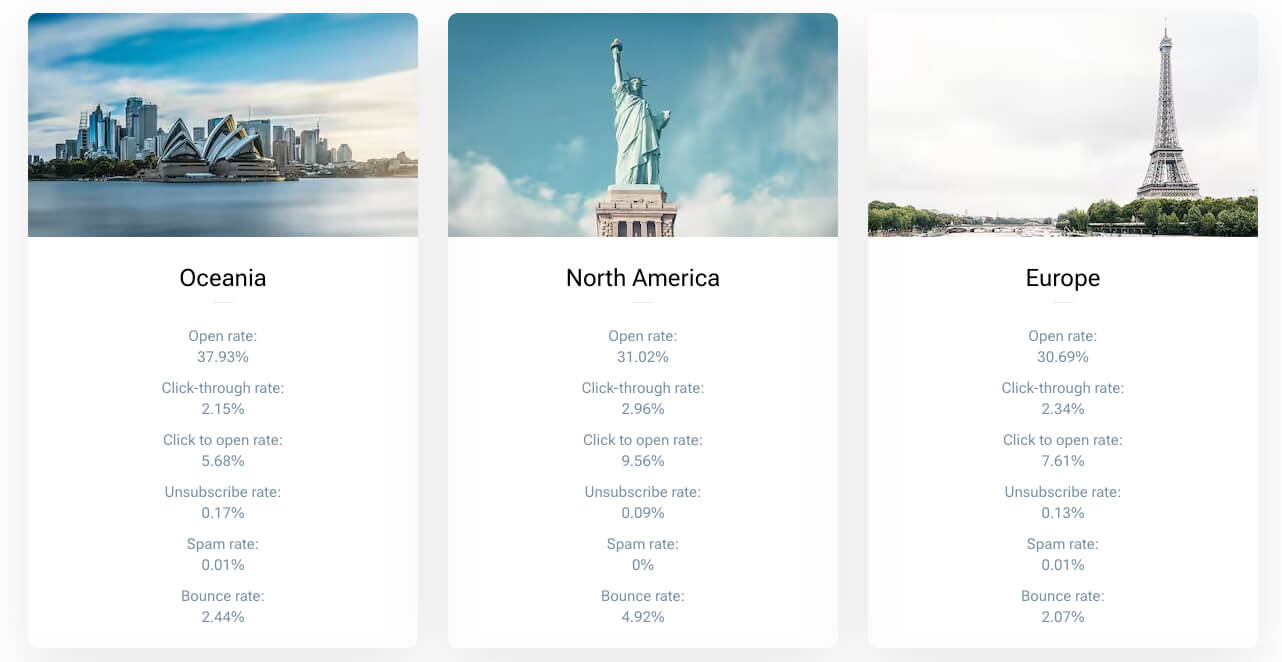
The most recent GetResponse Email marketing benchmarks sector summary also includes unsubscribe and spam rates. The Getresponse data is also useful since it gives a worldwide average of open and clickthrough rates by both B2C and B2B sectors. This gives one of the best sources for comparing email response statistics by country and region.
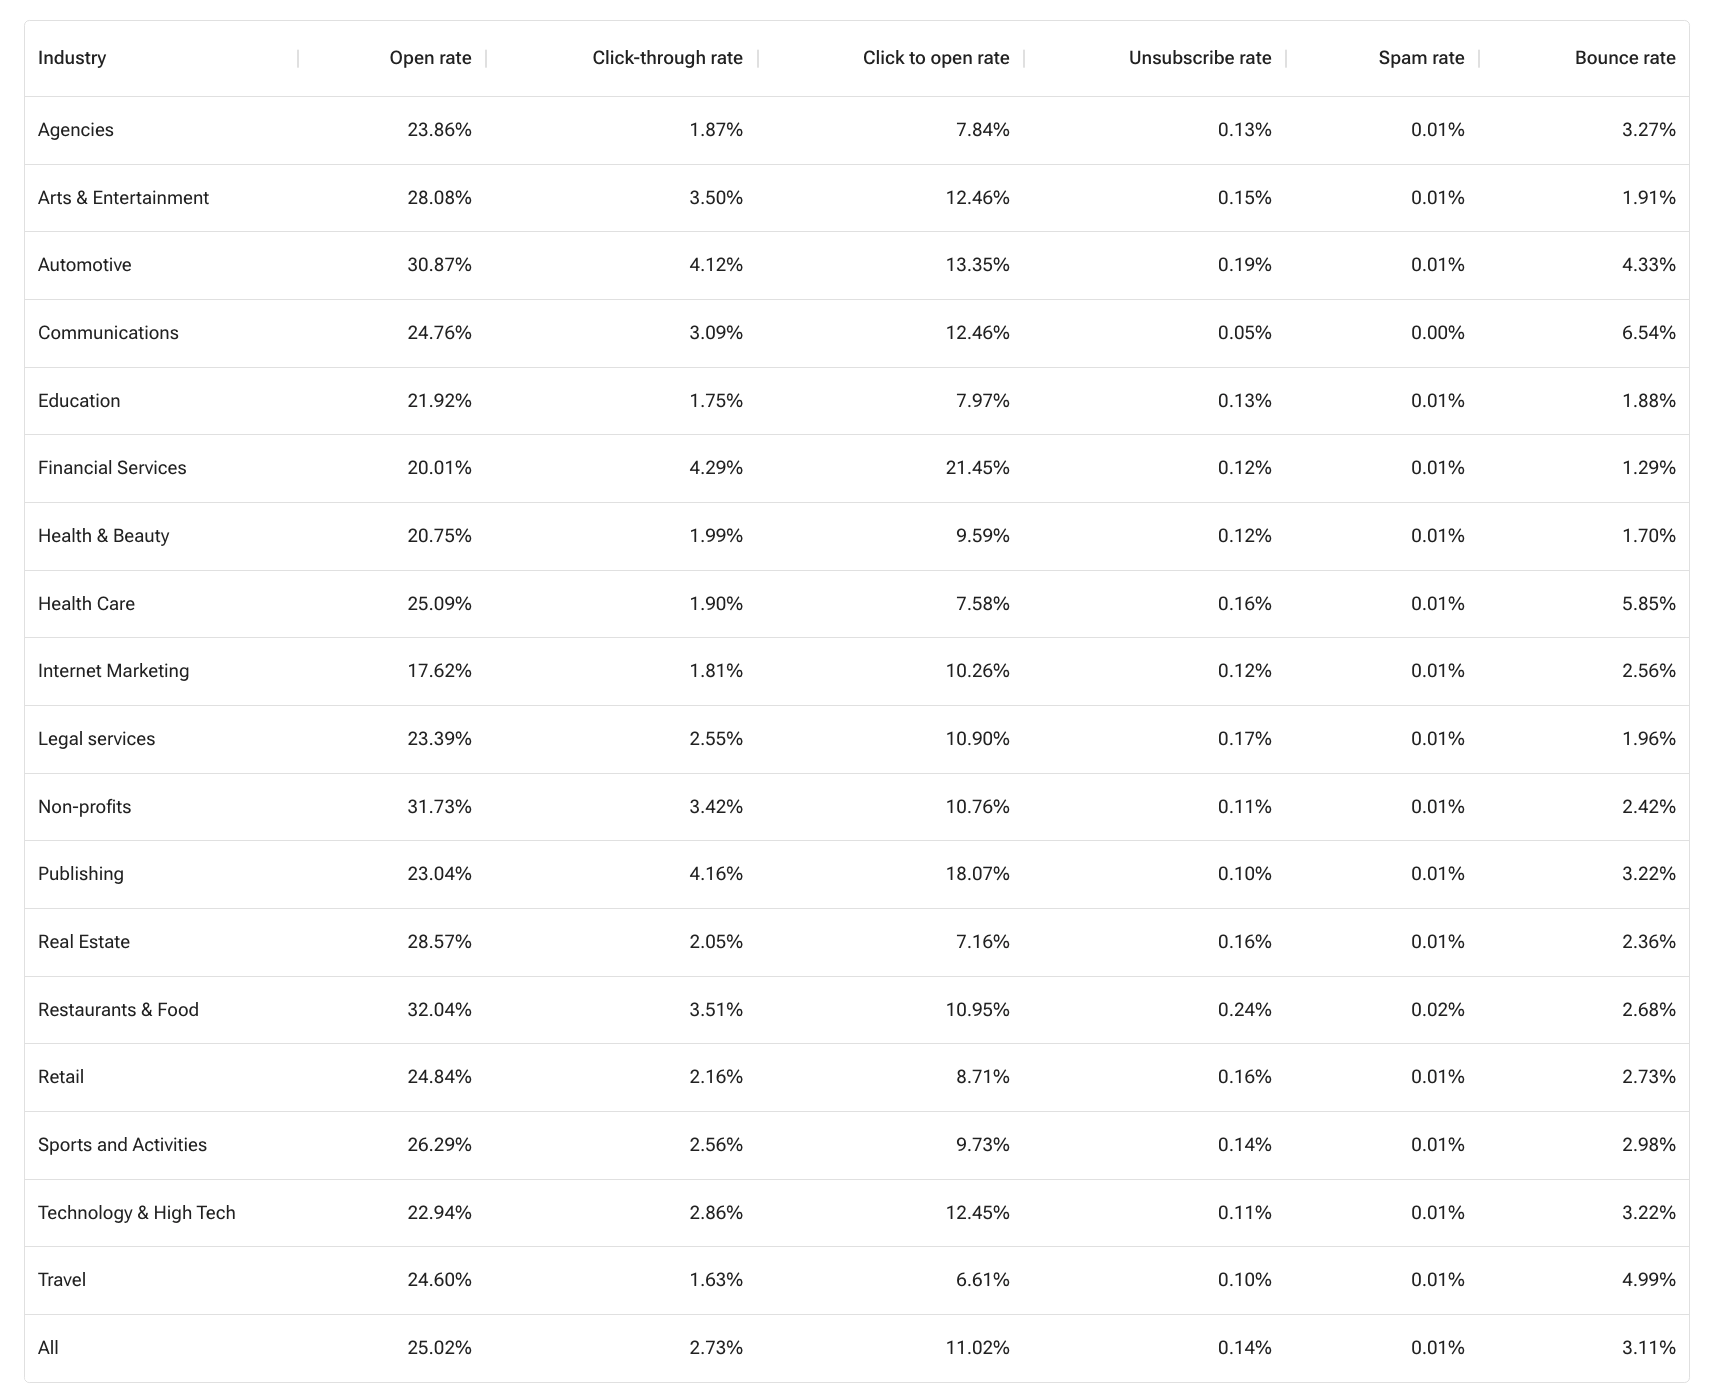
It's a useful report because it has the breakdown of opens, clicks and unsubscribes by industry for B2B and B2C markets. This shows a much lower response in some sectors such as Events, Education, and Legal Services.
If you're working for a retailer I recommend taking a look at the Barilliance Retail email marketing statistics which have good insight on engagement with different types of retail email and the impact of personalization.
I also like that includes Click to Open rates which is one of the best ways to compare the effectiveness of your email creative.
C. Global Direct Marketing Association (GDMA)
This is a compilation from multiple email service providers. We recommend this if you want to see more detail on one industry sector. For example, the GDMA International Email benchmarking report has good insights on retail and publishing which may be under-represented in individual providers.
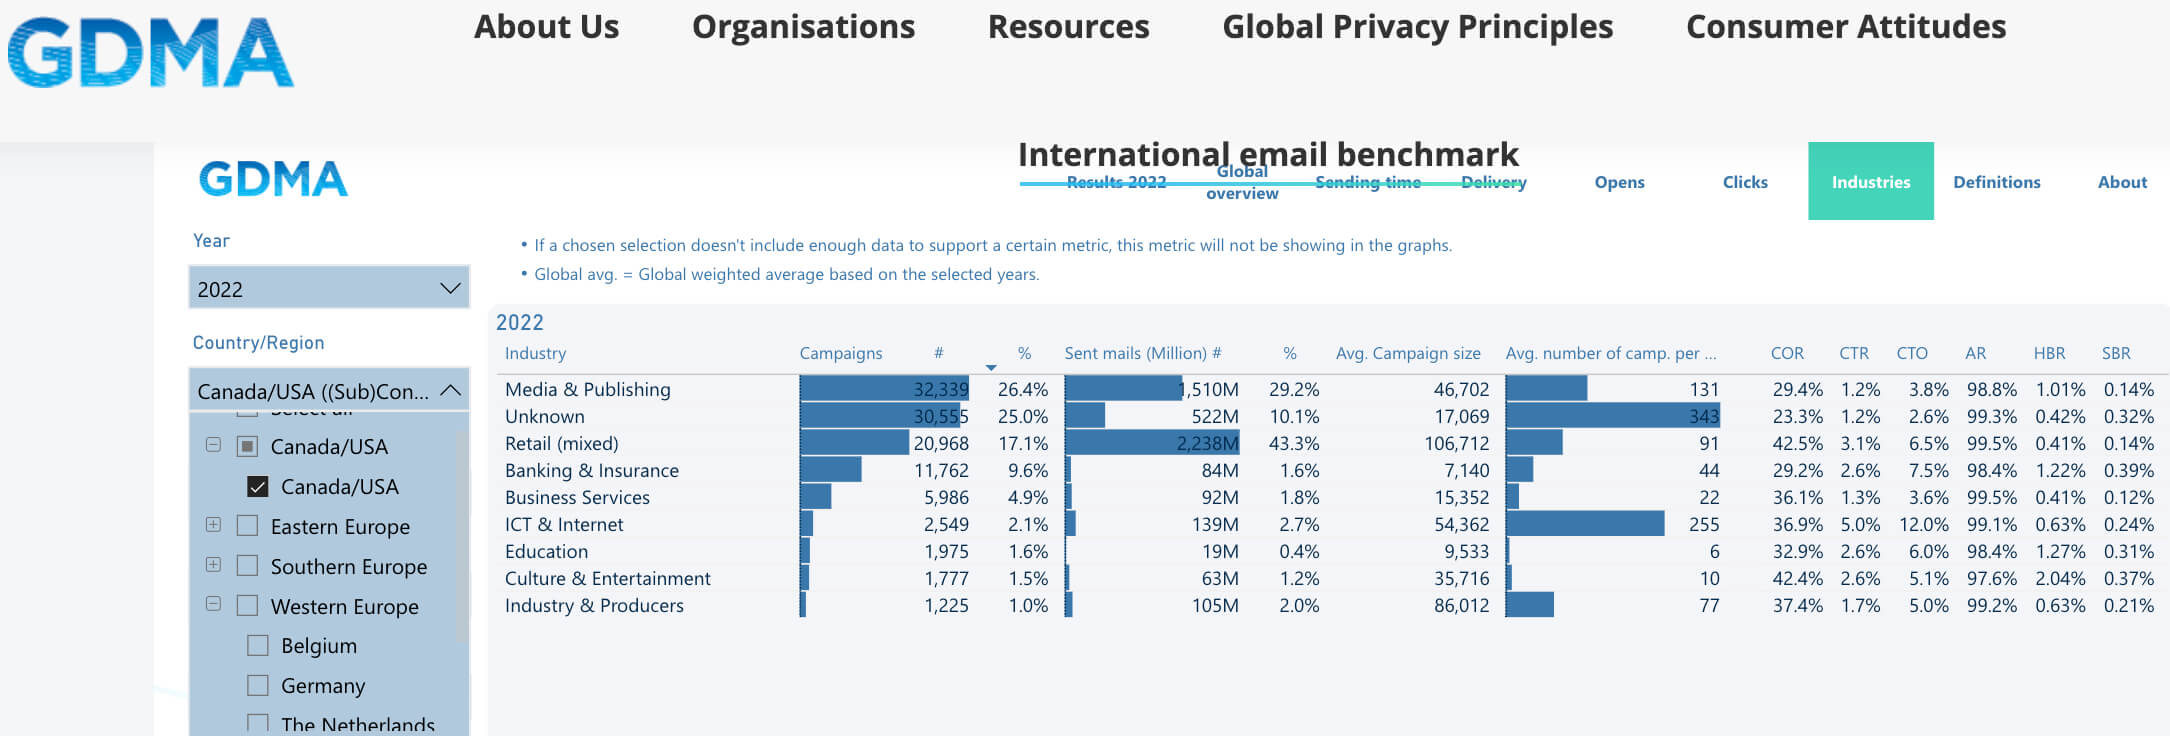
It also has useful standard engagement definitions across the providers and is the only source I'm aware of where you can benchmark response for emails campaigns of different sizes based on the number of senders.
Q2. What are the email engagement rates for larger businesses?
The results for Getresponse and Constant Contact are more typical of smaller and mid-size businesses, rather than large brands.
This Email benchmark compilation from Accoustic (formerly IBM marketing and commerce) represents 750 companies representing 3,000 brands in 40 countries. So breakdowns by EMEA, UK, US and APAC are available too. I've selected the breakdown by industry which is more useful to compare your performance with.
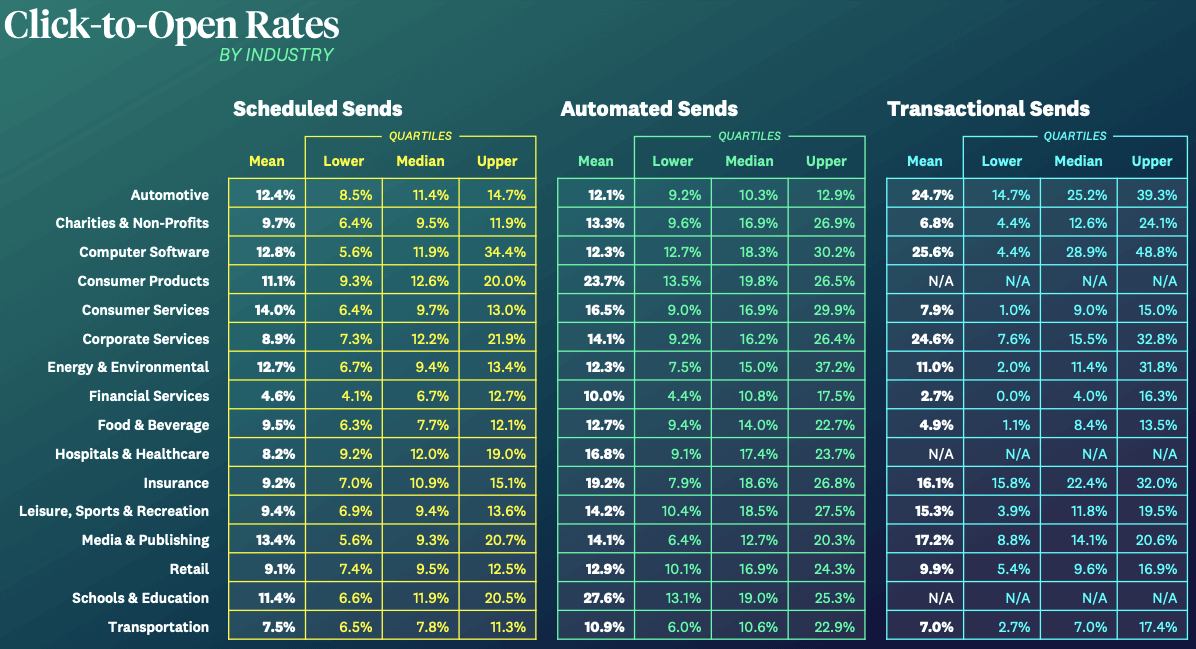
But what is the average email open rate? Here are the open rates with the mean showing the variation from the poorest performing sectors like publishing and tech to consumer brands and non-profits.
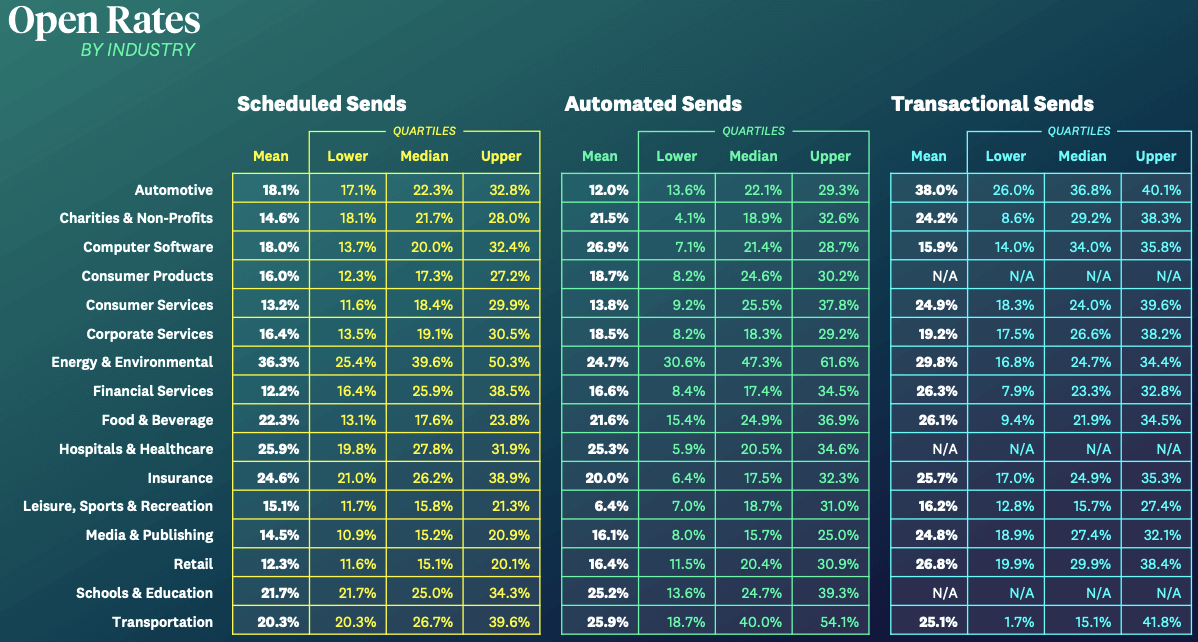
Rather than click-through rates that are also available in the report, I have picked out Click-to-open which shows engagement with the copy and creative. As a rule of thumb you should look for 10 to 15% CTOR, so can compare emails against this benchmark.
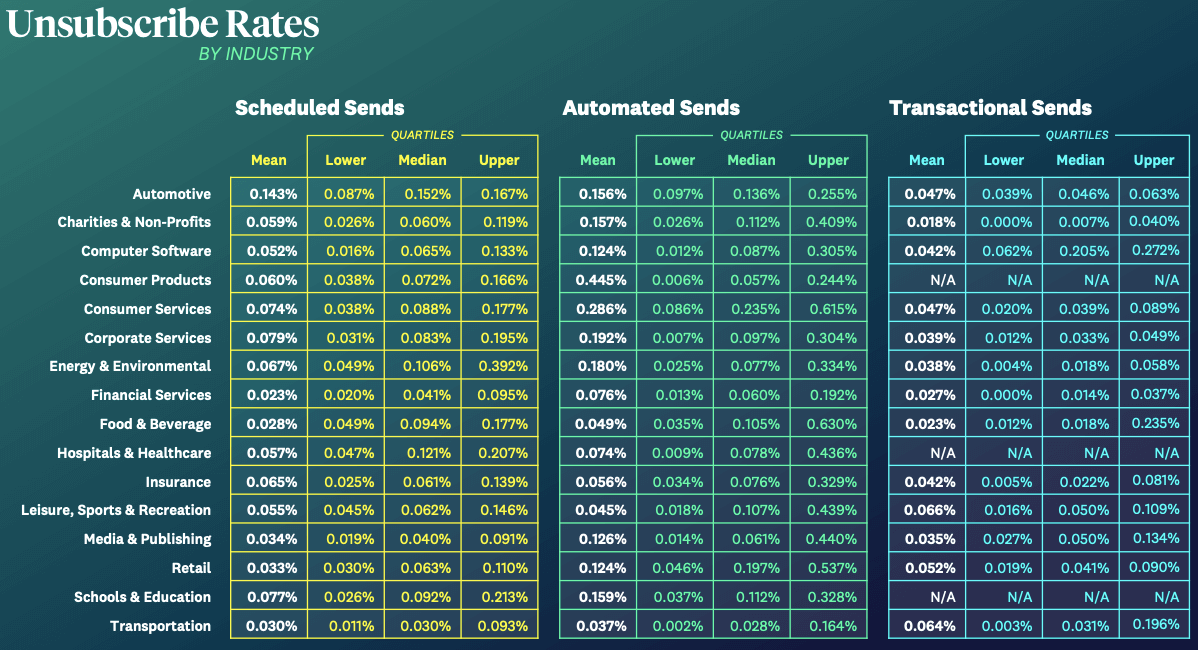
Finally, from this benchmark, I thought it would be useful to share the data on list churn as indicated by hard bounce rates and spam complaint rates. You don't want to go too high on these since you could have a problem with inbox delivery and likely your ESP will get in touch.
Q3. What is the breakdown of market share for email clients on mobile and desktop?
Litmus, one of the best sources for stats on email marketing, regularly produces a summary of reading environments and email clients, so you can see the latest figures. Note that Apple's Mail Privacy Protection (MPP) has the effect of reducing open rates, so when comparing sectors and countries, open rates are now skewed by different proportions of people using Apple Mail.
Did you know more than one third of emails are opened on an Apple iPhone?
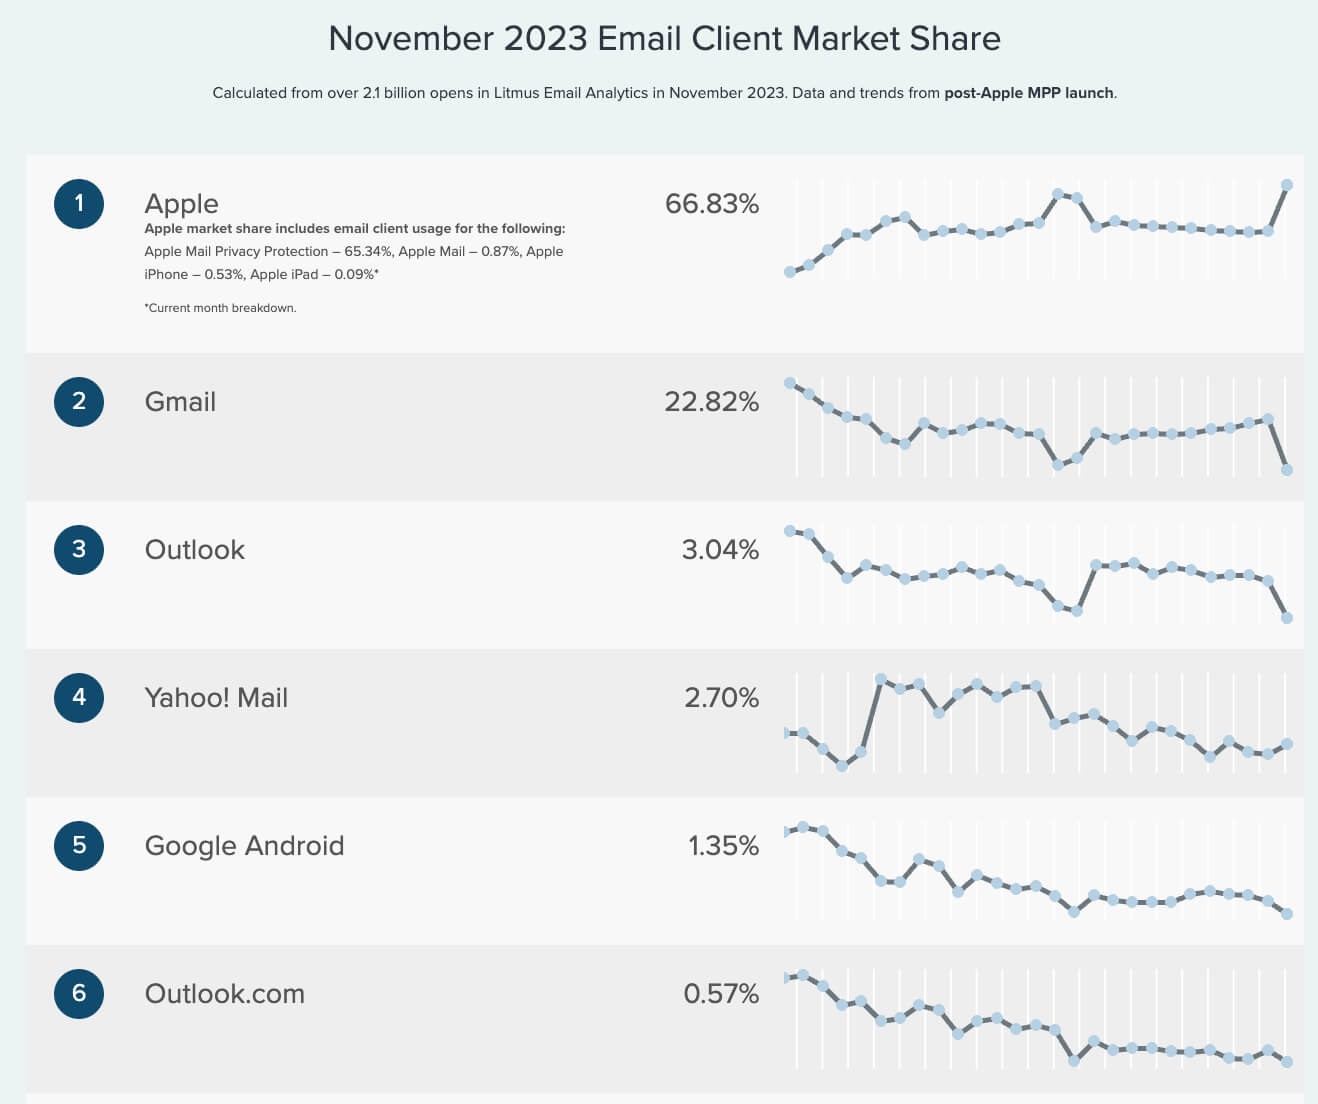
The latest Litmus compilation of email client market share shows why it's so important to consider how well your emails render on mobile. It's based on the percentage of opens on different platforms.
Q4. What is a good open and clickthrough rate? How do these differ for different industries?
Although we are presenting averages in this article, to answer this question it's important to go beyond averages in your analysis of your email marketing so you can compare 'apples with apples'. It's worth segmenting your email response in this way:
- By email type (see below)
- By offer type
- By audience demographics
This will give you a better indication of performance as will analysis by revenue per 1000 emails sent. To show the difference of email type, the GetResponse Email marketing benchmarks include these averages by email opens.
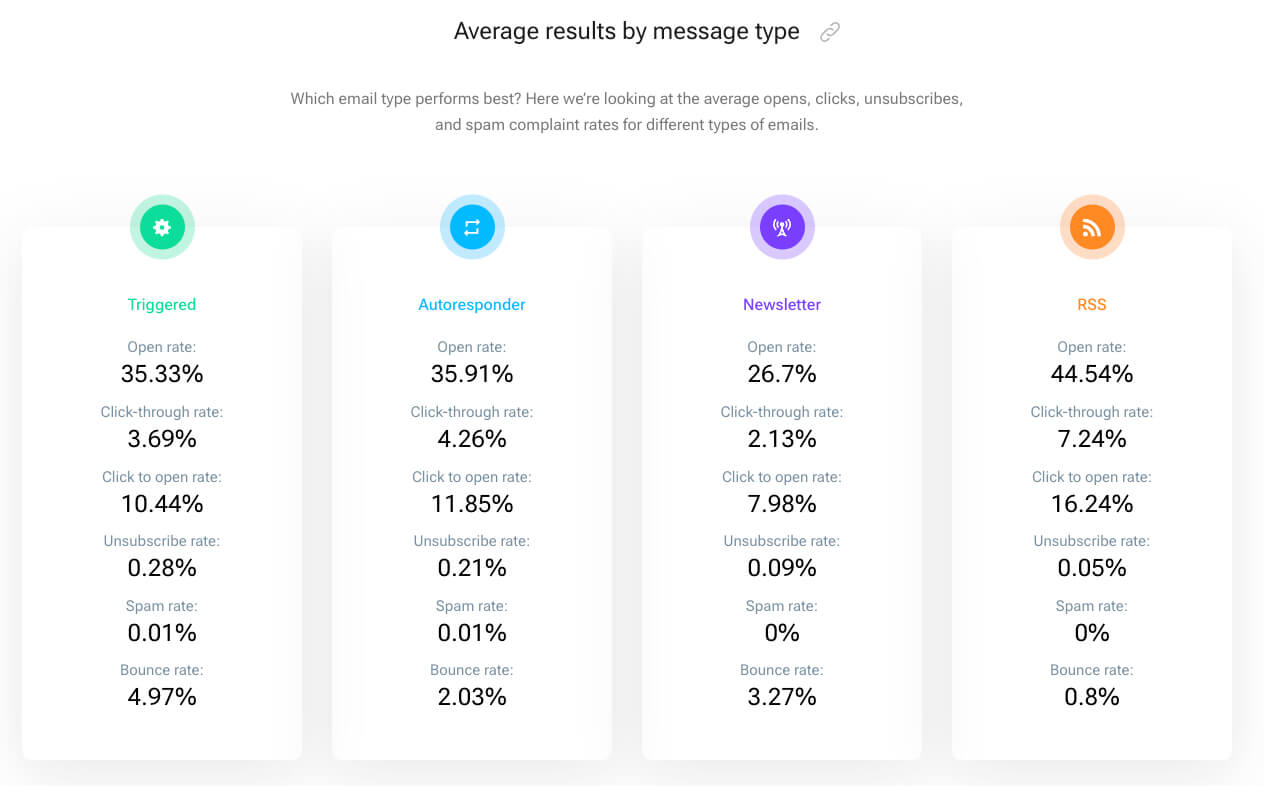
It's no surprise that triggered and autoresponder (welcome) emails have higher open and click rates since they are more relevant or immediate, more in the context of an action that a subscriber has taken. It shows the power of marketing automation.
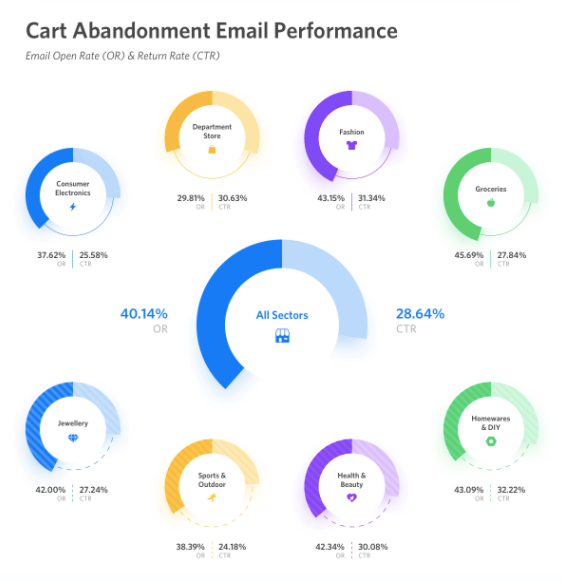
Sales Cycle also has some good insight showing response rates for remarketing emails like cart abandonment email rates in their E-commerce Remarketing report.
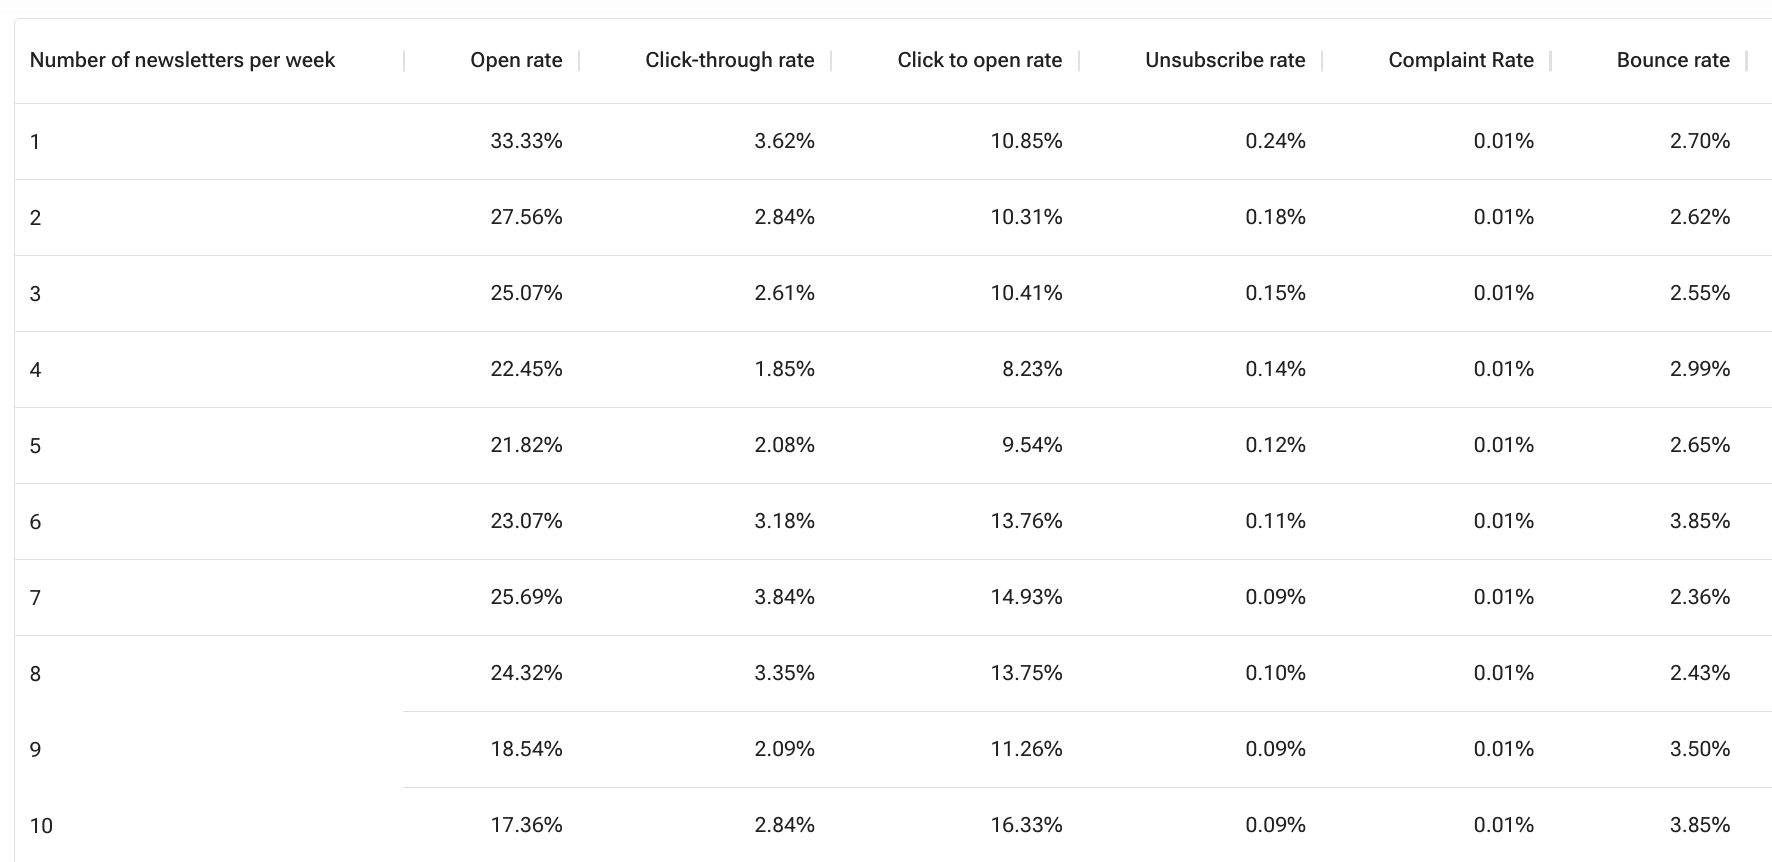
Q5. How do engagement rates vary by email frequency?
Deciding on frequency is a key part of your email contact strategy. GetResponse has some useful data showing how open and clickthrough rates decline as frequency increases. The charts below are not updated for the latest data which are still indicative of the relative engagmement. Refer to GetResponse for the latest figures.
First for enewsletters...
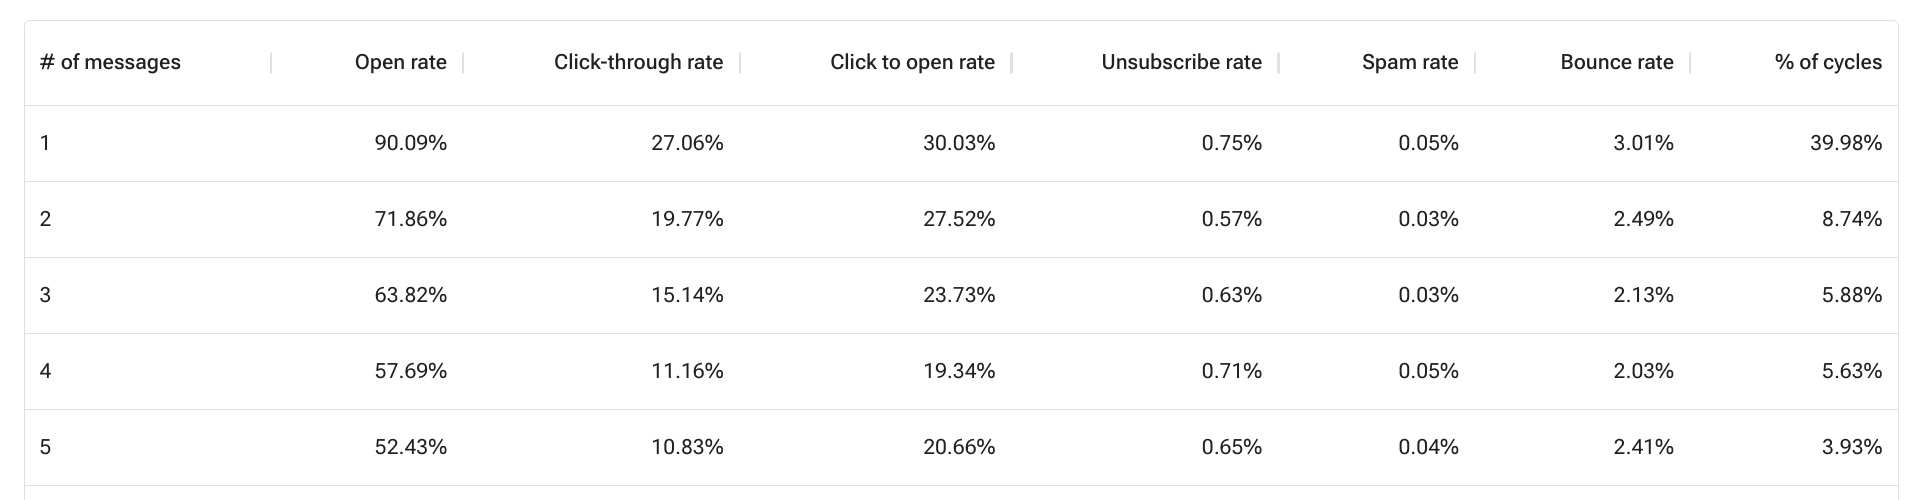
Then for number of autoresponder messages...
 This is useful insight since it shows that higher frequencies will produce higher overall responses. Note that in the case of autoresponders - typically used for welcome sequences, the majority only send a single message, so they are missing out by only sending one.
Q6. How do the number of characters in the subject line affect response?
Get a response also have some useful insight on how engagement varies depending on the number of characters. In the subject line. You can see that there is a sweet spot between 20 and 60 characters where they open and click through rates are highest.
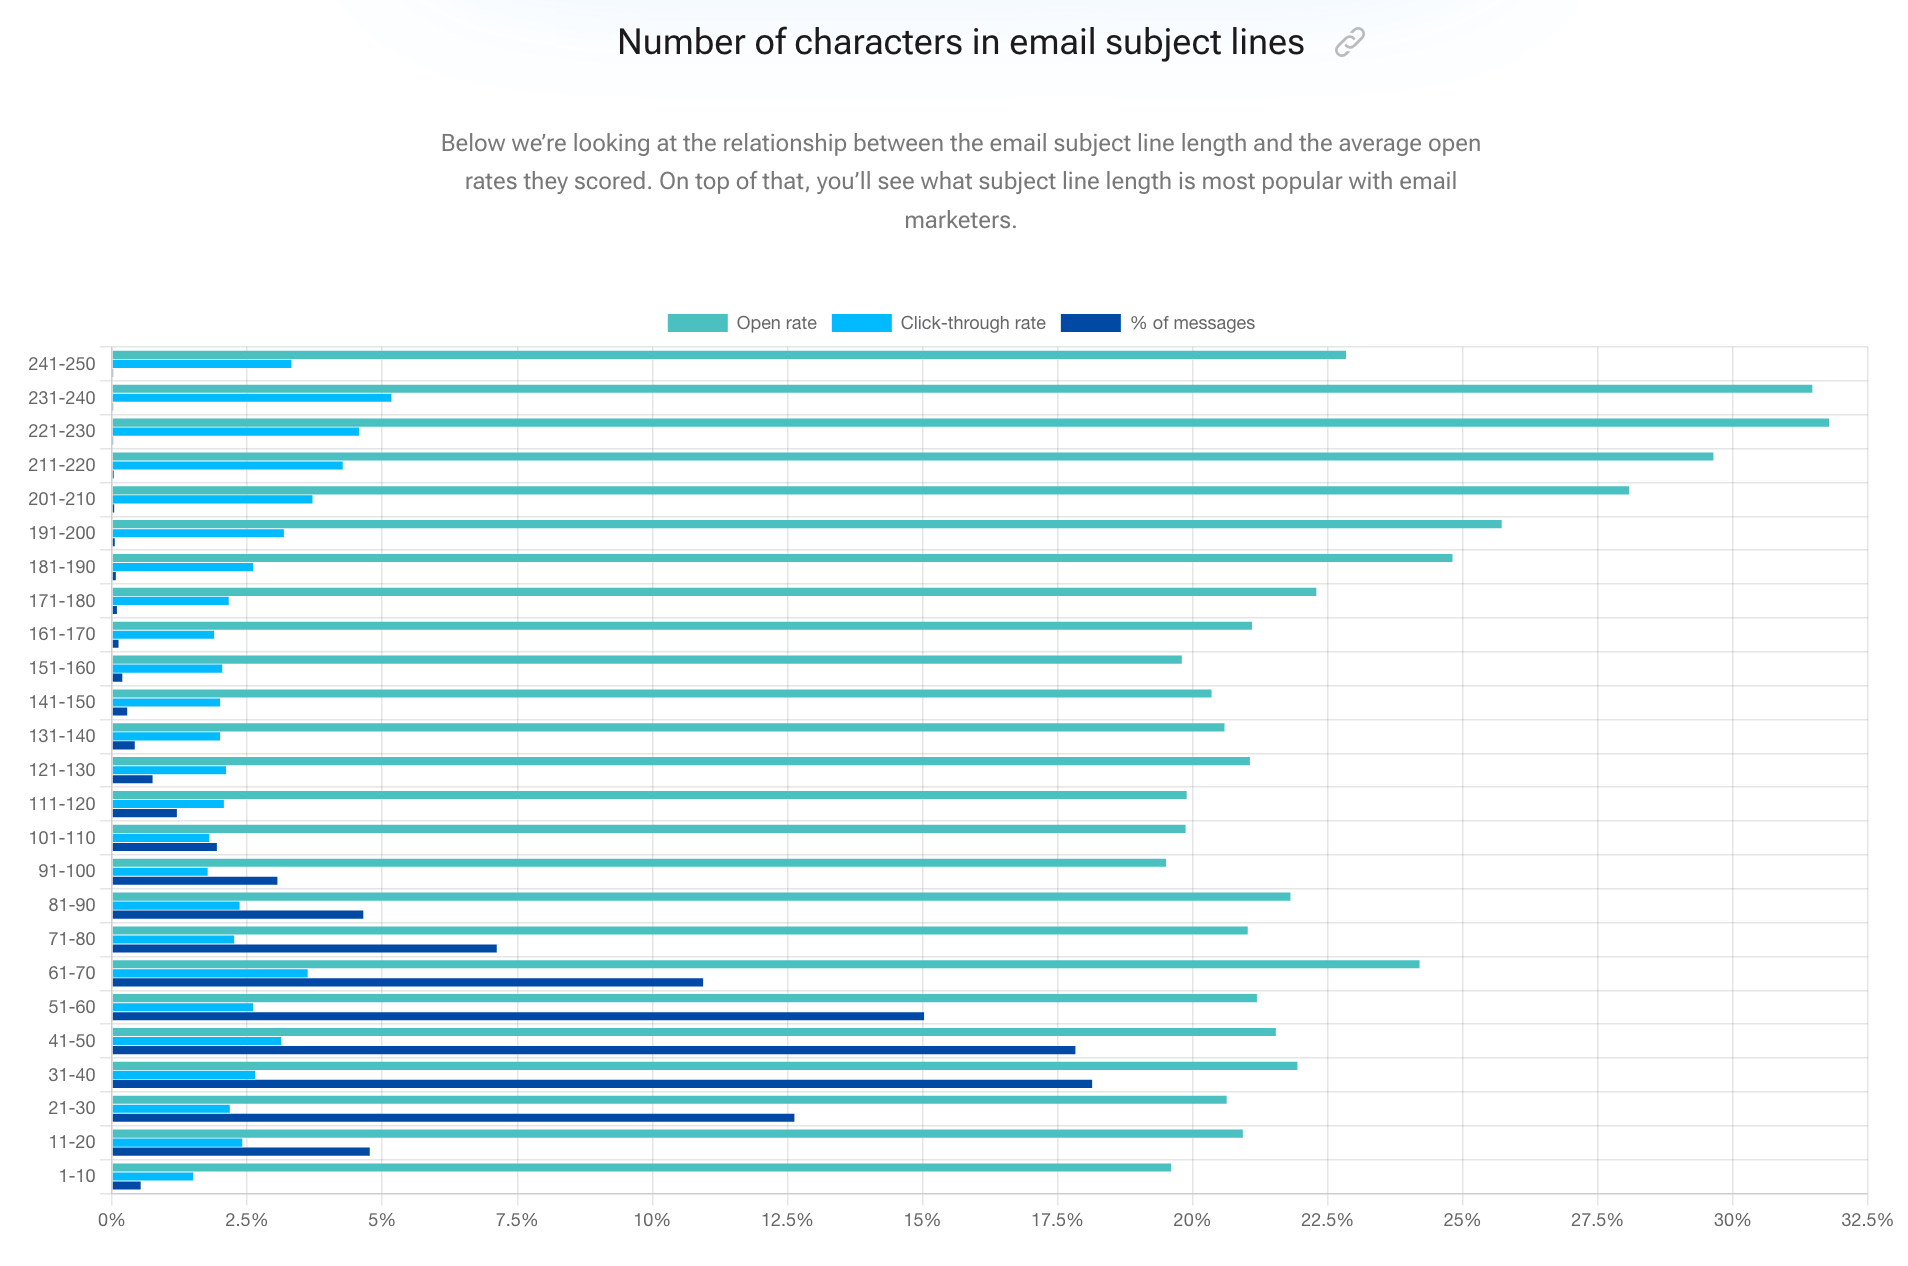
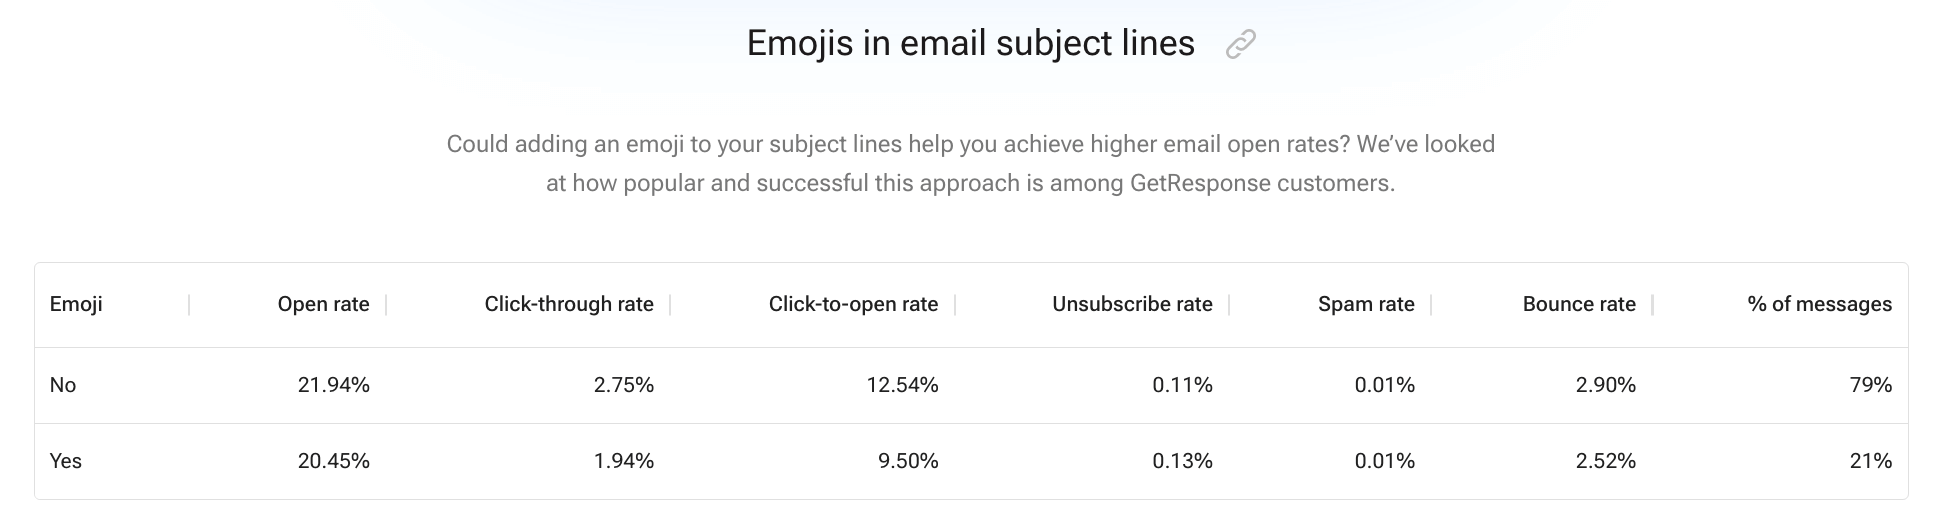
They also present insight on the impact of including emojis in the subject line. While this is often thought to increase open rates, their data suggest that on average it decreases both open and click through rates so it is a technique to use sparingl
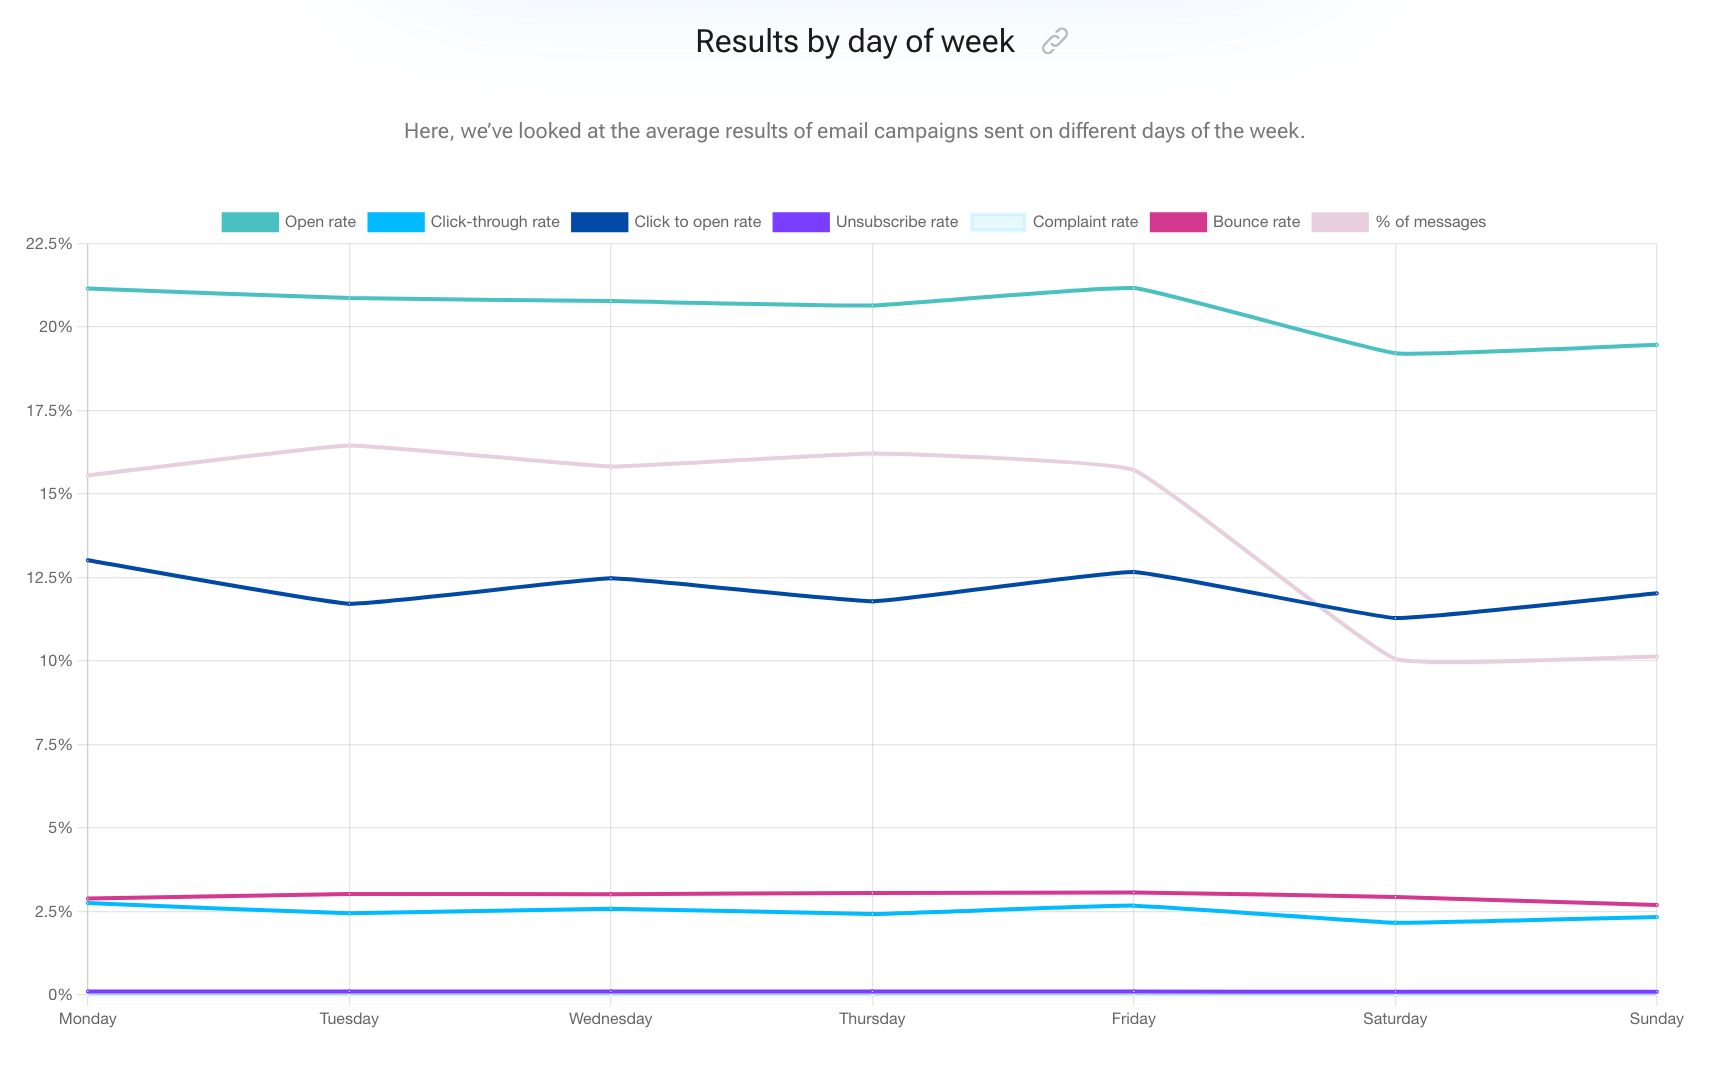
Q7. How to email open and click-through rates vary based on the day of the week?
Knowing the best day of the week to send your emails is really useful so this is another frequently asked question. The data from get response shows that open rates are actually fairly constant on different days of the week, but with Friday slightly higher than other days, the weekends are definitely lower note that this varies for business-to-business and business-to-consumer Email marketing. For mid-week Tuesday Wednesday, Thursday tends to be higher.
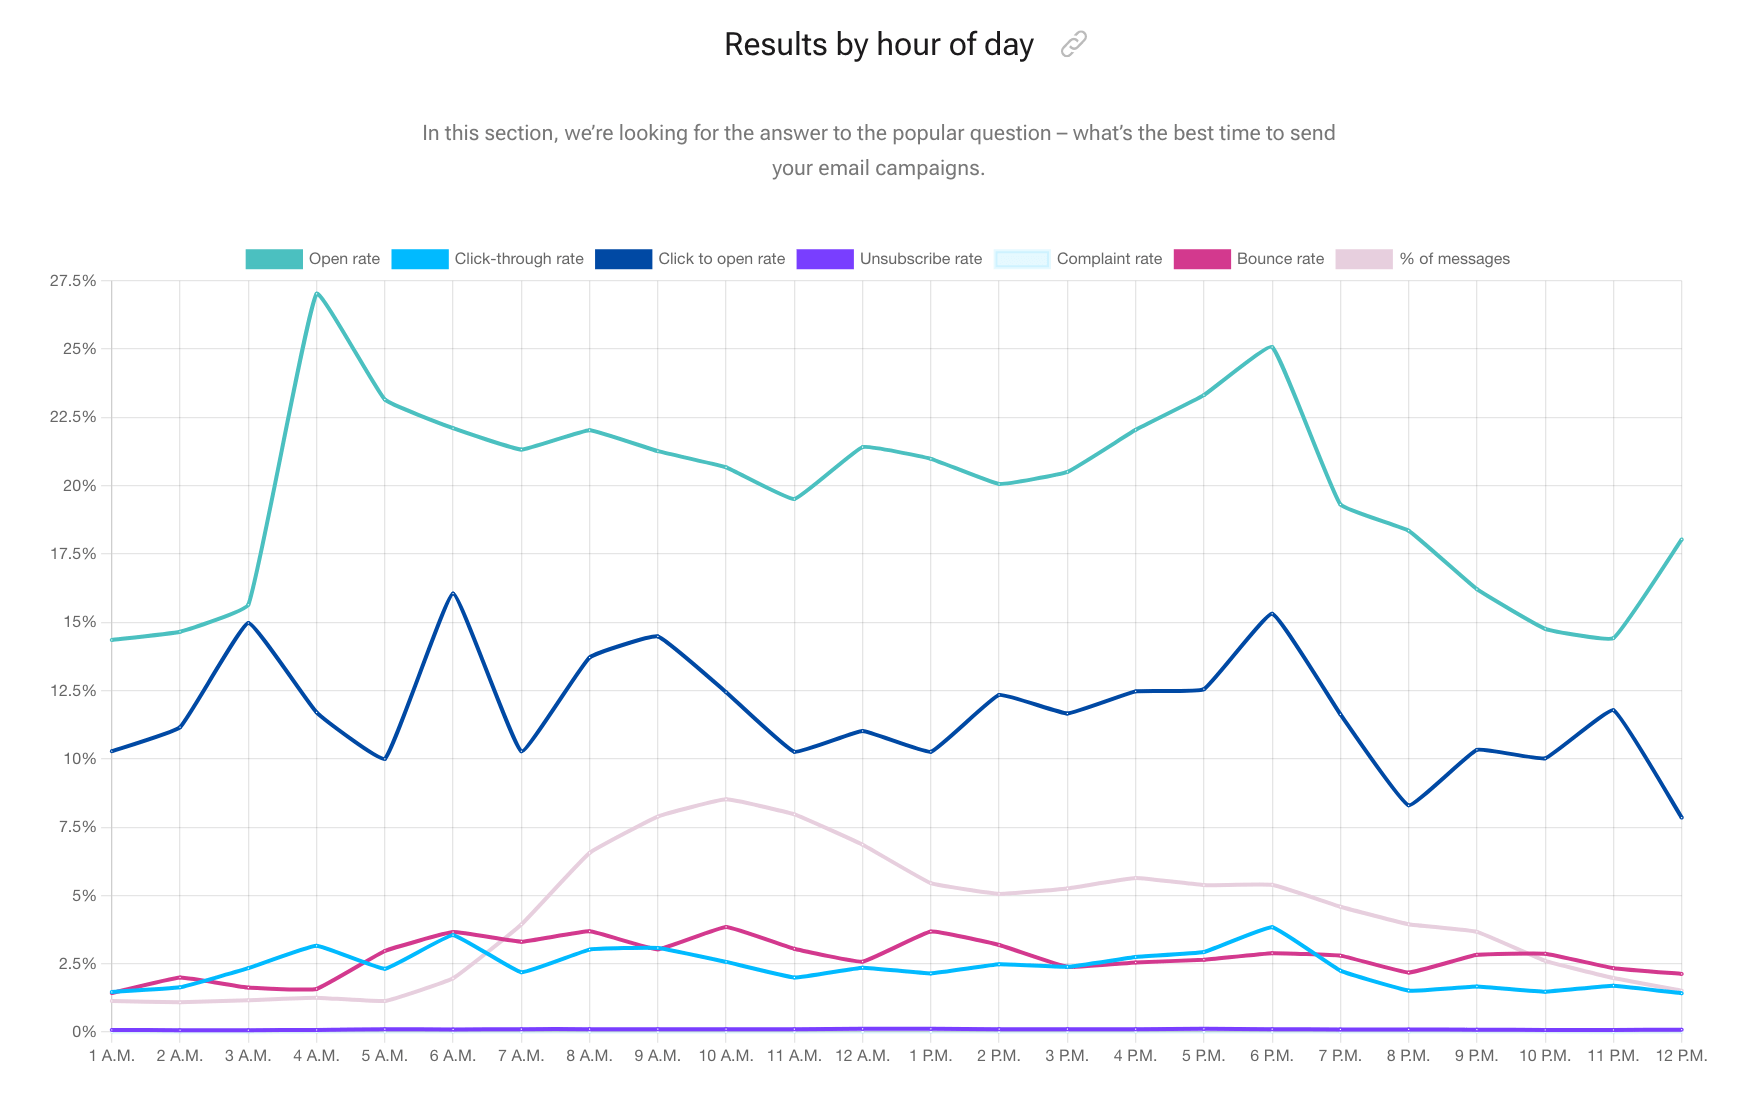
Q8. How do I open and click-through rates vary based on the time of day?
The best time of day to send and newsletter early email campaign. It's another frequently asked question. This tends to vary a little more after the time zones have been normalised. You can see that around breakfast time, lunchtime and especially early evening are the best times - we can speculate that these coincide with commutes and starting/finishing work.
Next steps for your email marketing
Looking to optimize your email marketing strategy? Join thousands of Smart Insights members using Smart Insights tools and templates to inform their email marketing opportunities, strategies, and actions. We have an email marketing toolkit, learning path and templates with recommendations on best practices and standard operating procedures to improve your email marketing.
When you implement your RACE Growth System plan, you can measure and optimize your results through a data-driven process proven to generate growth for your business. Join Smart Insights as a Free Member to download your RACE Growth System guide today.
Create your 90-day plan with the RACE Growth System
Download your free RACE Growth System guide today and unlock our three-step plan of Opportunity, Strategy and Action to grow your business.
Download guide


