Consumer mobile usage and adoption. Use our mobile marketing statistics compiled from the best free sources to inform your digital marketing strategy and mobile user experience
It's hard to imagine today that there was a time when smartphones weren't the major device for accessing the Internet. Desktop used to dominate. I recall a headline from back in 2008 when it was forecast by by Mary Meeker, an analyst at Kleiner Perkins Caufield Byers that "Mobile to overtake fixed Internet access by 2014". That same year, Eric Schmidt of Google exhorted businesses to take a 'Mobile First' approach to designing web experiences, informed by customer-focused smartphone analytics. Our mobile marketing statistics compilation contains
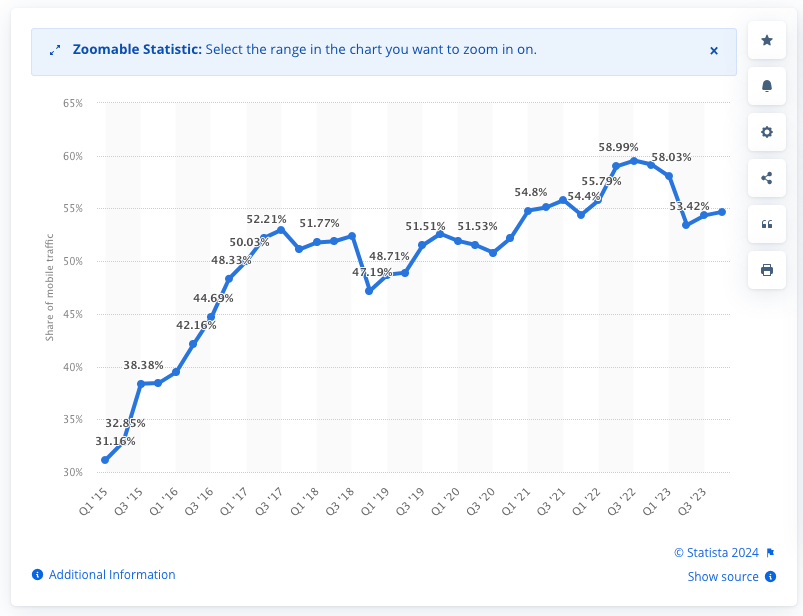
15+ years later, in 2024 understanding mobile engagement of online users is more vital than ever so digital markers can eng2age and influence their mobile audience. Today, the latest research from Statista shows that more than half of all web traffic is mobile.
In this compilation, we'll share the best quality statistics on how consumers interact with brands via mobile responsive websites, mobile apps or the key digital channels like search, email or social media.
Free digital marketing plan template
Our popular marketing planning template is structured across the Smart Insights RACE Framework. Join Smart Insights as a Free Member to download our digital marketing plan template today
Access the Free digital marketing plan template
Mobile marketing statistics compilation - what you need to know
The mobile statistics that the team at Smart Insights curate in the regular updates to this article are grouped under these headings for key questions marketers need to answer about mobile to help them compete:
- Q1. Time spent using mobile media
- Q2. Percentage of consumers using mobile devices
- Q3. How many website visits are on mobile vs desktop devices?
- Q4. Mobile conversion rates vs desktop and visit share for e-commerce sites?
- Q5. Mobile media time and app usage
- Q6. How important are mobile ads?
- Q7. What percentage of Google Searches are on mobile?
So that's the introduction showing the importance of mobile, let's dig into the details to prove it.
Q1. How much time do consumers spend using mobile media?
Mobile media use varies throughout the day. This is important to understand for dayparting, i.e. buying AdWords and display media. This daypart media use from comScore Global Digital Future in Focus shows how desktop is still important for daytime at work audiences, but Tablet and smartphone dominate in the evening.
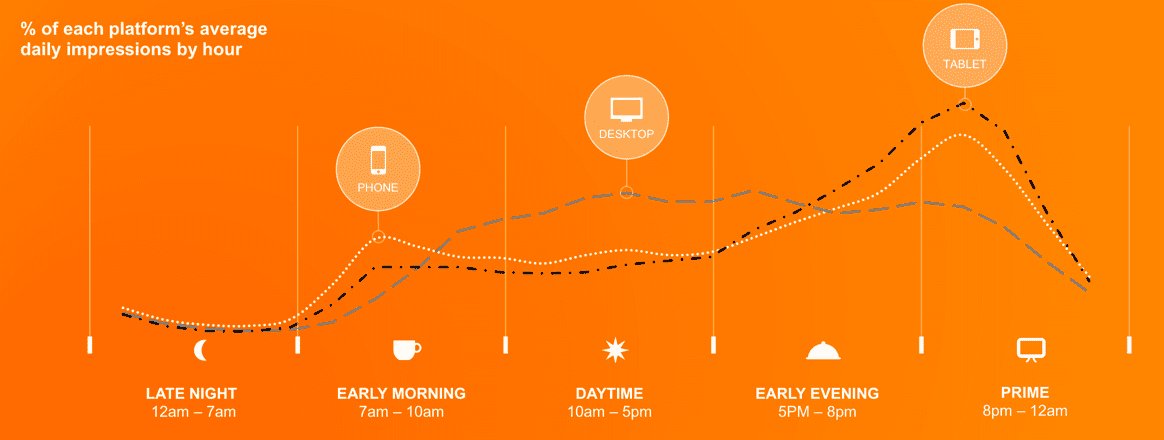
The implications are increasingly clear - if you're not able to reach your audience through mobile search or display, or you're not providing a satisfactory mobile experience, you will miss out compared to competitors who are.
Looking to optimize your marketing strategy to win more customers? We've got marketing tools and templates to support you in applying a data-driven, customer-centric approach to your marketing planning.
Q2. Percentage of consumers using mobile vs desktop devices?
With the wide adoption of 'Mobile first design', it's important to remember that in developed countries, much device usage is multiplatform i.e. consumers will use both smartphone and desktop. This Comscore panel data added in the 2024 update to this post shows how the multiplatform form the majority in many countries.
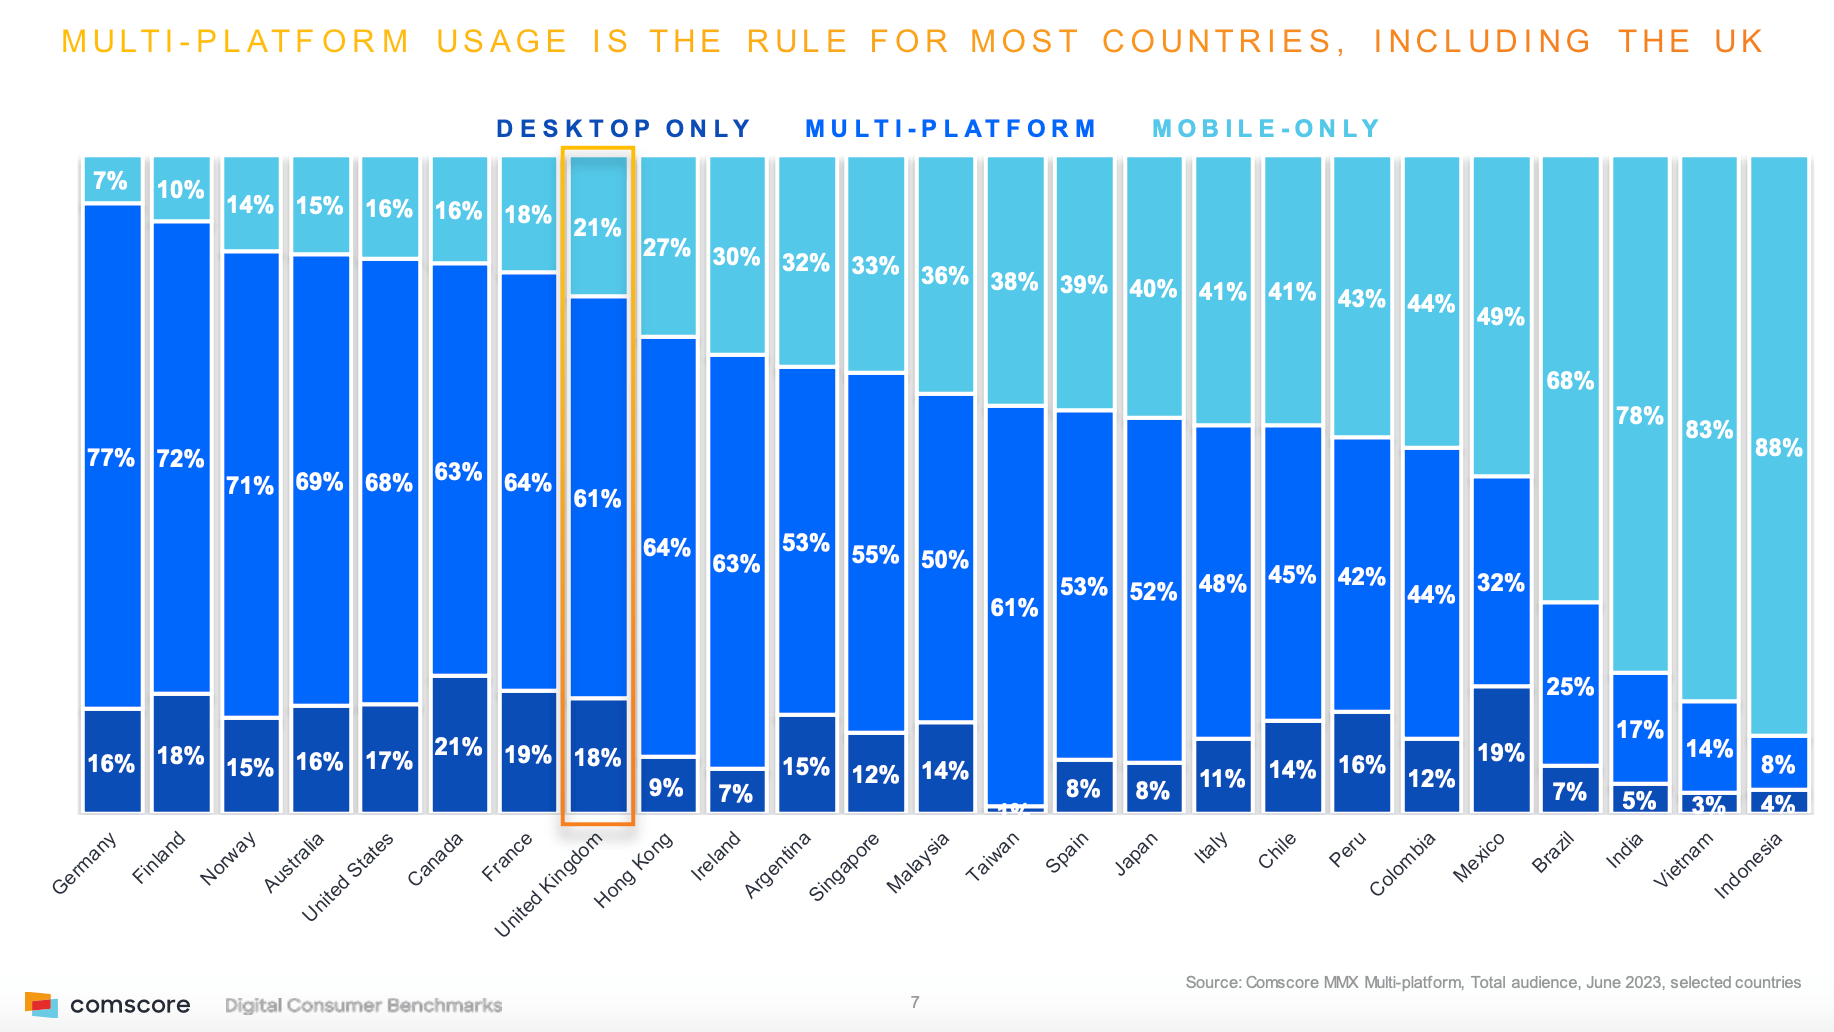
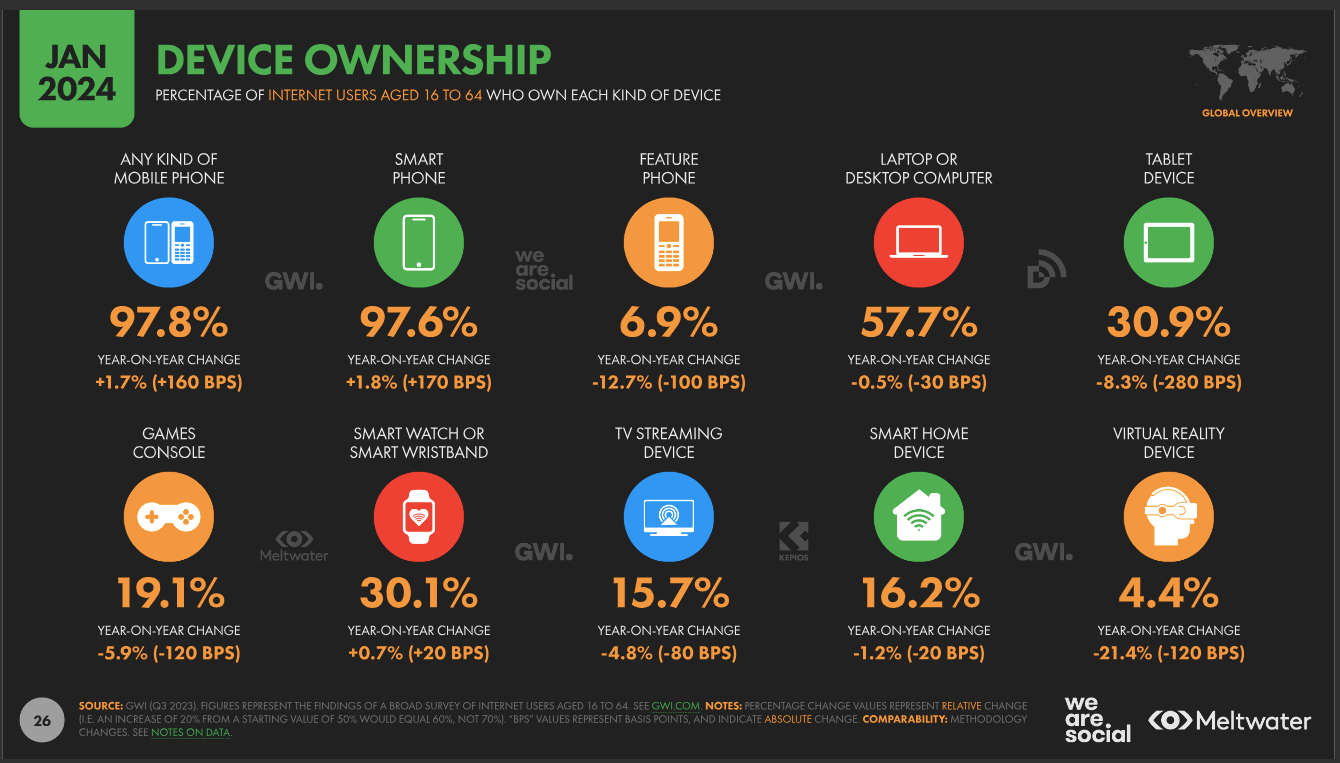
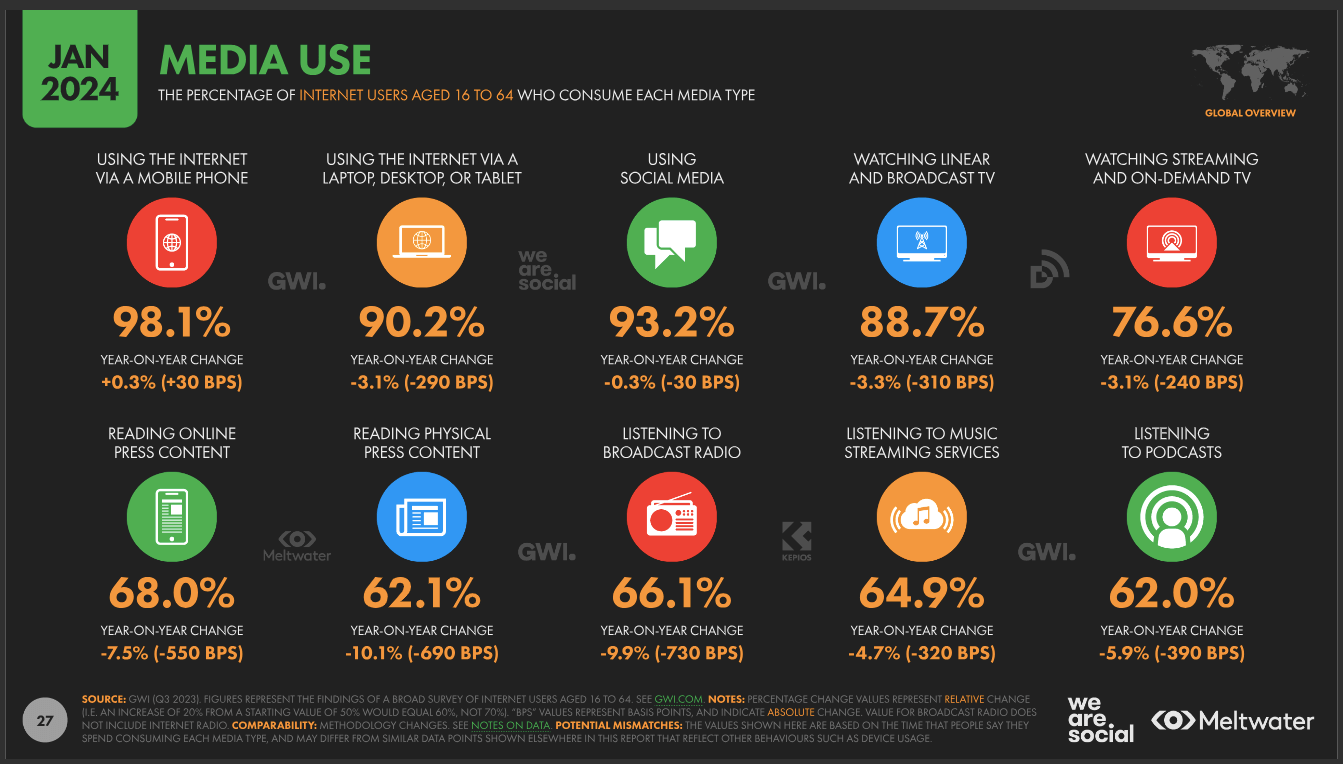
Device ownership data from the latest Datareportal Global Overview shows that 97.6% of internet users aged 16-24 own a smart phone. What's more, while 90% of internet users are accessing the internet via a laptop/desktop/tablet, no 98.1% are accessing the internet on their phone.
We recommend you understand this multichannel switching behavior for your own brand. It's important to keep track of the split between users of mobile and desktop devices visiting your site.
To save you time in searching for the latest, most reliable online marketing benchmarks, our digital marketing statistics compilation gives you a single source of the latest and most reliable sources to help you compare your investments in digital channels and your performance against others.
Download Business Member resource – online marketing statistics compilation
Saving you time when you need the latest stats for a presentation or report, this complication will help you make your case for investment in digital marketing to colleagues or clients.
Access the Online marketing adoption statistics compilation
Q3. How many website visits are on mobile vs desktop devices?
This insight from Statcounter shows the varying proportion of desktop vs mobile visitors through time. It shows that although mobile visits exceed desktop globally, desktop experiences remain important and should be tested for.
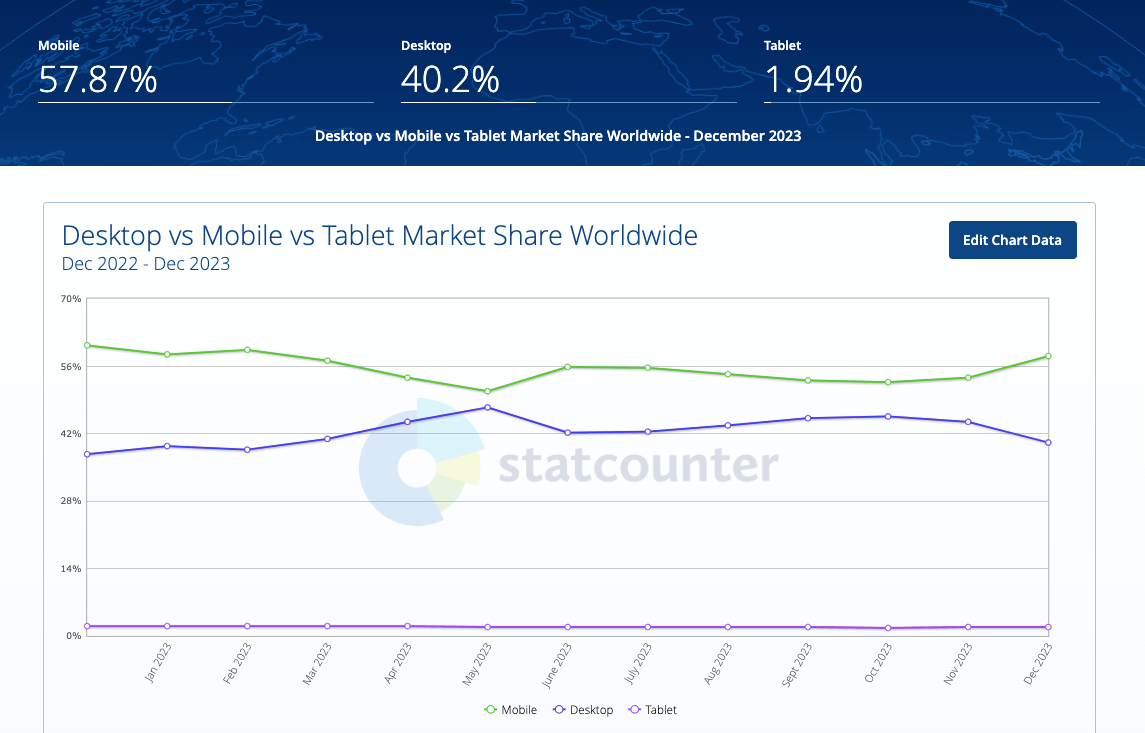
Statcounter is useful for showing detailed insights about mobile usage such as specific mobile handsets, operating systems and device resolutions.
The growth in mobile usage prompted, Eric Schmidt, then Chairman of Google, to recommend a Mobile-First design approach. The reality is that while smartphone use is overwhelmingly popular for some activities such as social media, messaging, and catching up with news and gossip, many consumers in western markets also have desktop (and tablet) devices which they tend to use for more detailed review and purchasing.
So we need to think about strategies to engage the multichannel majority not simply 'mobile first' or 'smartphone adoption'.
But with many high-value site visits still on desktop, it's important when designing using a responsive web design that the desktop experience isn't degraded and this has led to many larger businesses using an adaptive web design where layout and content are tailored for desktop, tablet, and smartphone screen dimensions.
Smart Insights members are using the latest digital experience research to ensure all key digital touchpoints achieve their conversion rate objectives.
Our digital marketing adoption statistics are aimed at saving you time when you need the latest stats for a presentation or report you're working on against a deadline. The visual stats are carefully selected to help you make your case for investment in digital marketing to colleagues or clients.
Download Business Member resource – online marketing statistics compilation
Saving you time when you need the latest stats for a presentation or report, this complication will help you make your case for investment in digital marketing to colleagues or clients.
Access the Online marketing adoption statistics compilation
Q4. Mobile device conversion rates and visit share for e-commerce sites?
We have a separate compilation of e-commerce conversion stats if you're creating a business case for mobile-optimization. This data is also valuable since it shows the variation in conversion rate by mobile type. This is the latest 2023 data from the Dynamic Yield conversion benchmarks for users from 400+ brands, collected over 300M+ total sessions.
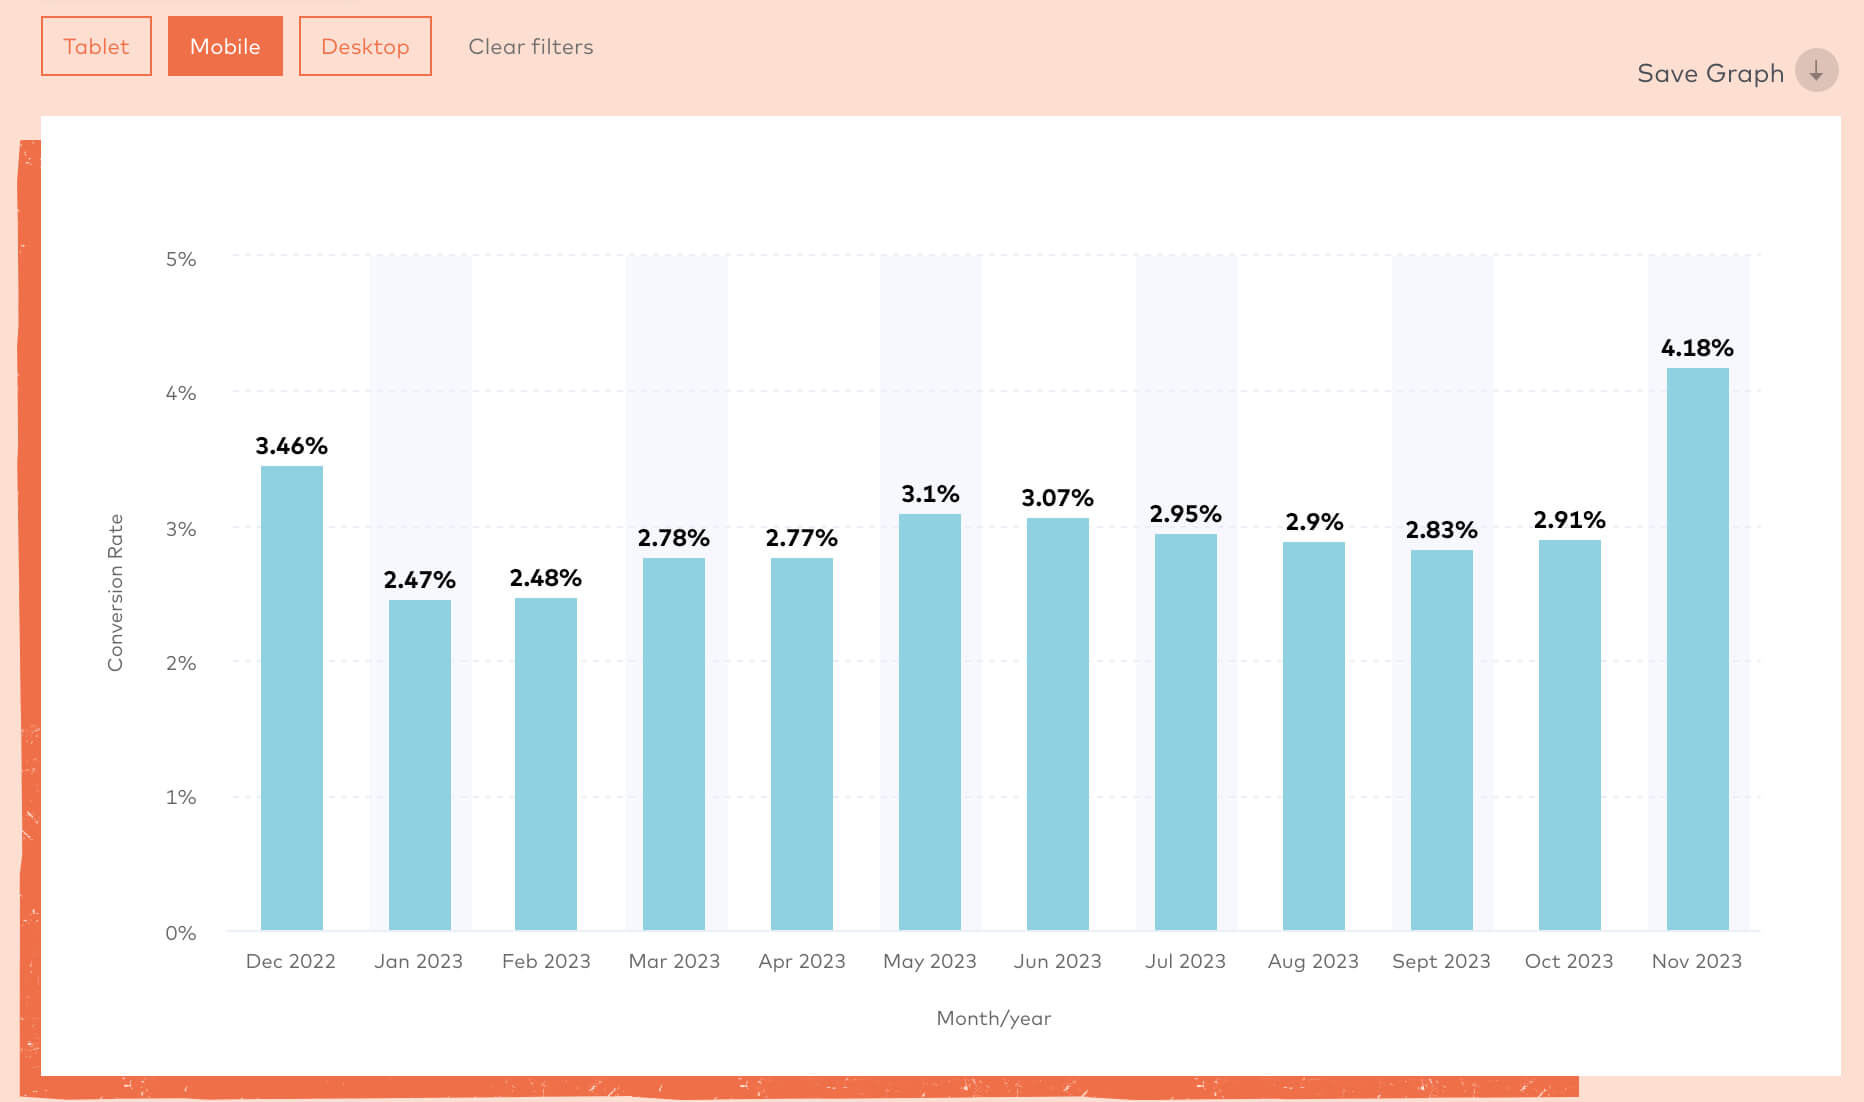
Smartphone conversion rates for retail average around 3%, but conversion is higher during seasonal sales in November and December. Desktop conversion rates tend to be higher since this is a preferred method of checking out for the multichannel majority who have a choice between mobile and desktop.
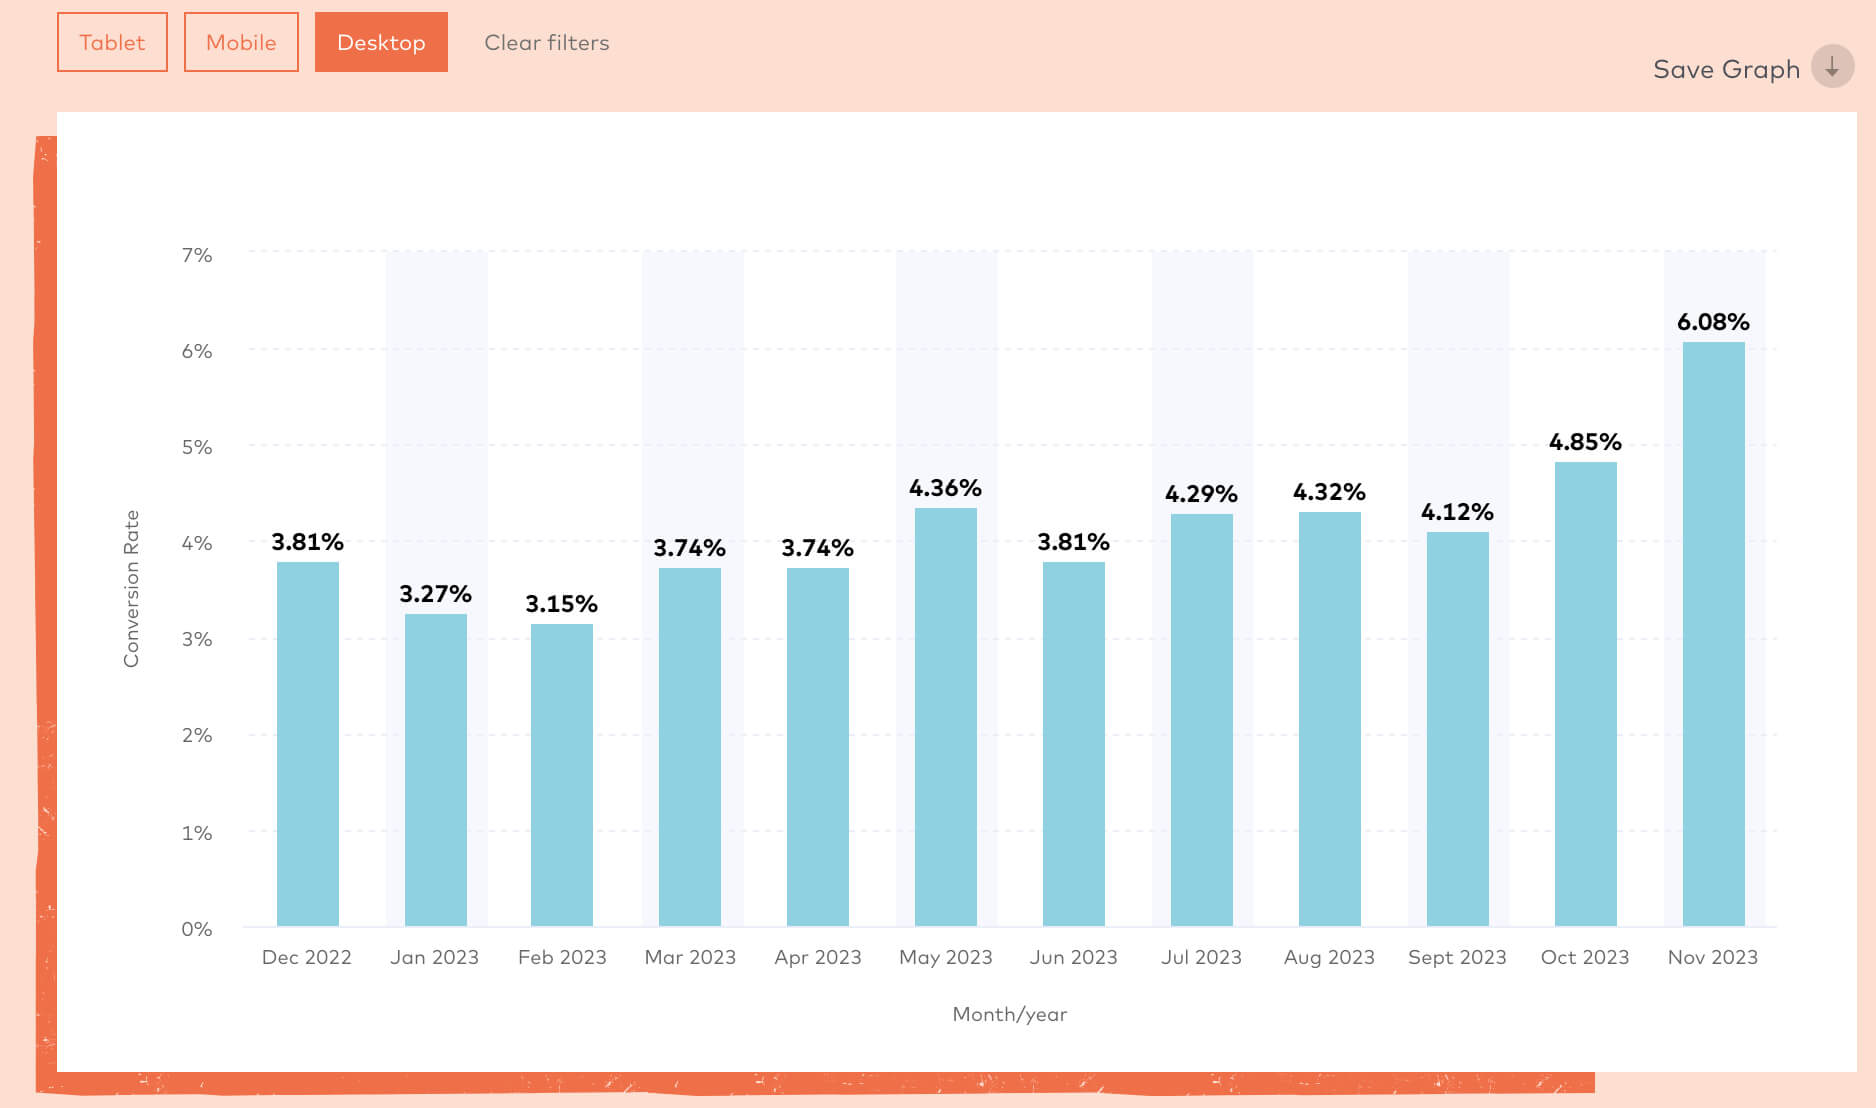
If you're planning responsive web optimization, this data is very valuable since it shows the average order value on mobile, tablet, and desktop.
Q5. Mobile media time and app usage
Consumer preference for mobile apps vs mobile sites should also be thought through as part of mobile strategy. This data from the UK presented by Comscore shows that although the number of mobile app and mobile web users are similar...
Amount of time on mobile apps is 5.5 X that of the mobile web
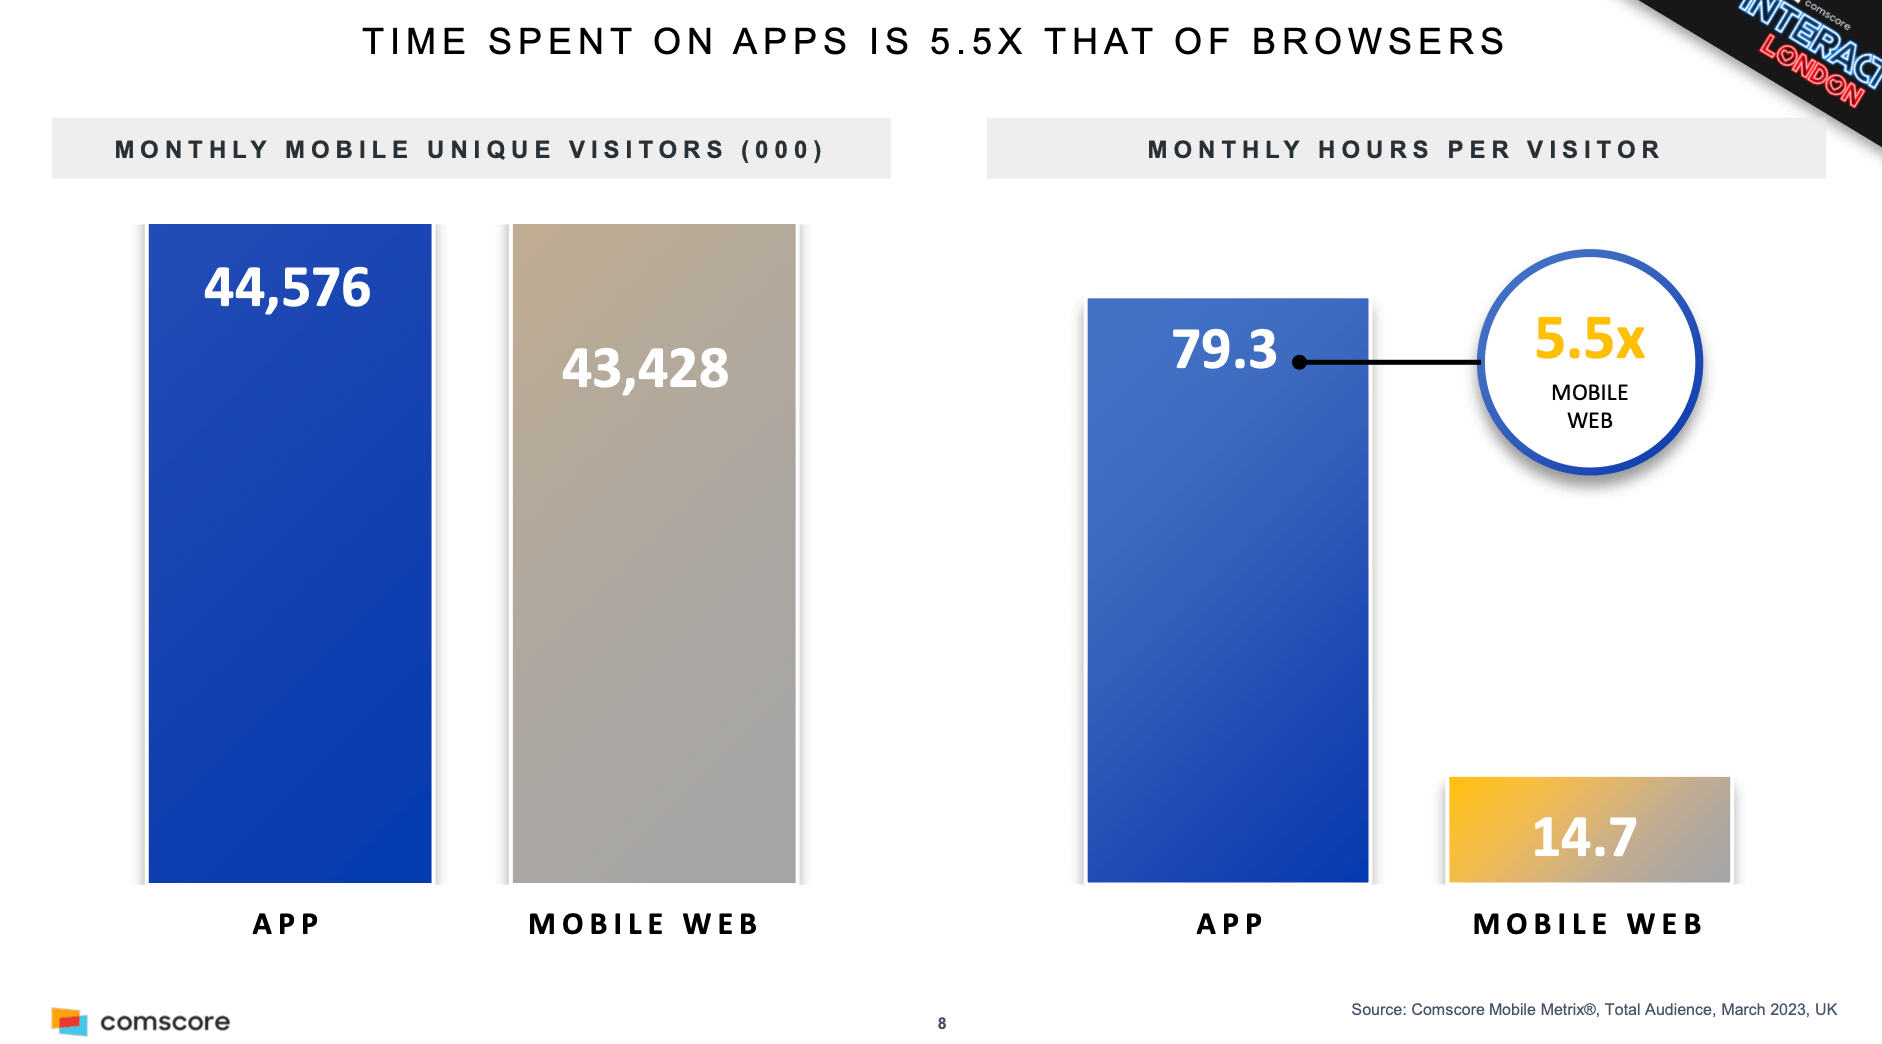
Although the time on mobile is a good argument for investing in apps, much of this can be explained by people using social media, email and news apps on their phone. Apps for brands can often not be justified unless built for retailers or brands with a direct-to-consumer (D2C) sales opportunity (e.g. Fashion and sports brands).
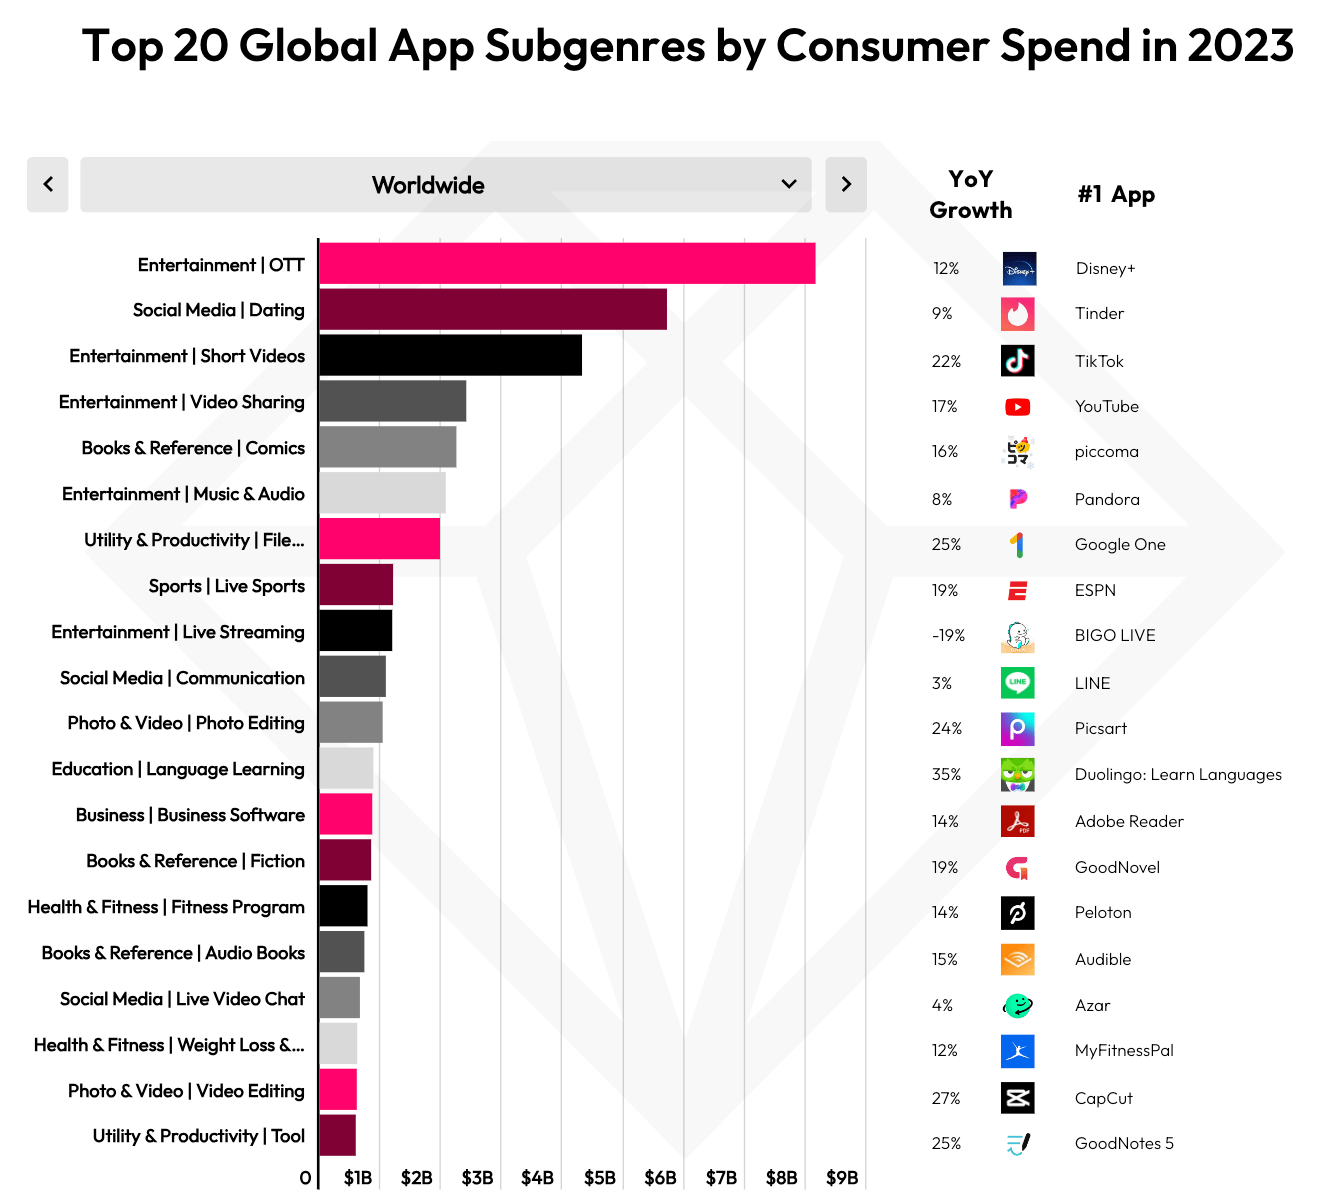
Data.ai provides one of the best sources for understanding mobile app usage. Their State of Mobile 2024 report reveals that despite nearly everyone owning a smartphone, new app downloads and total hours spent continue to increase.
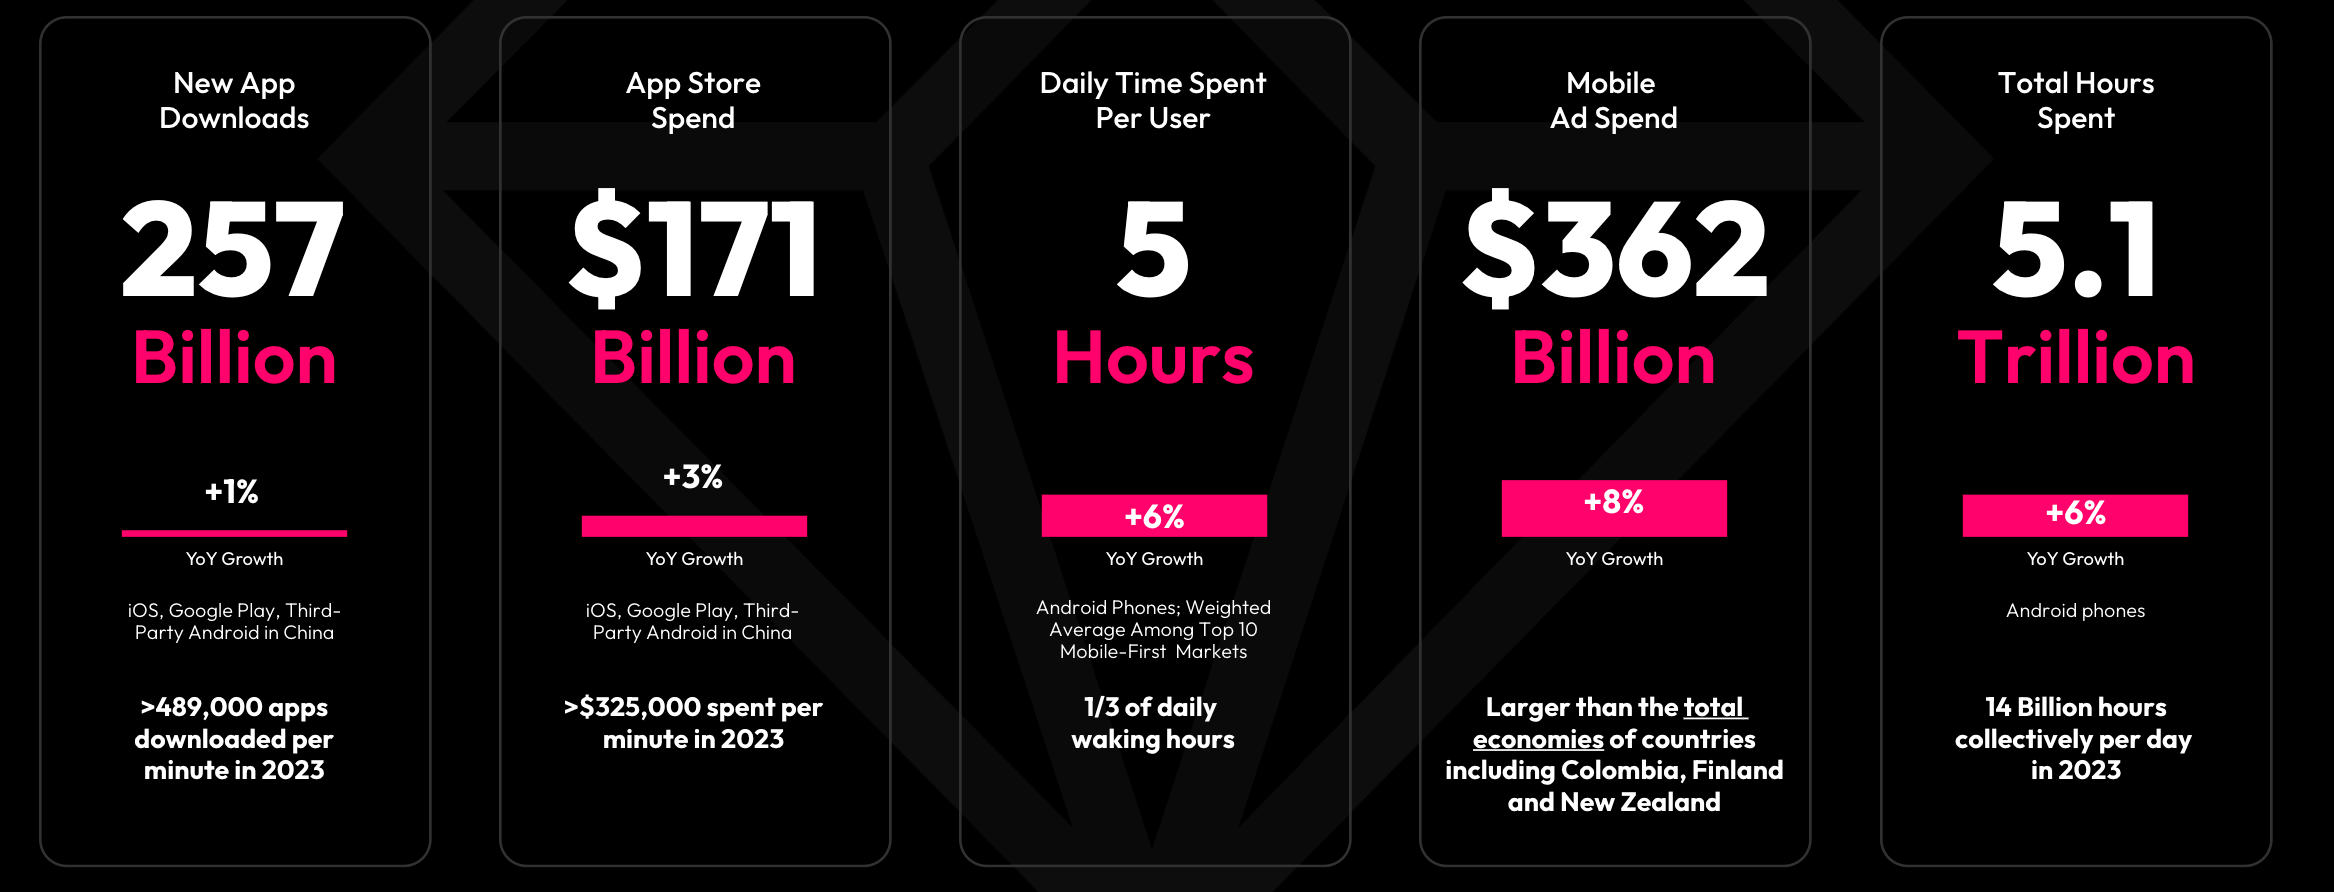
4 trillion hours a day is difficult to fathom, but this average out to 3 or more hours per person per day.
Top mobile app categories - Worldwide
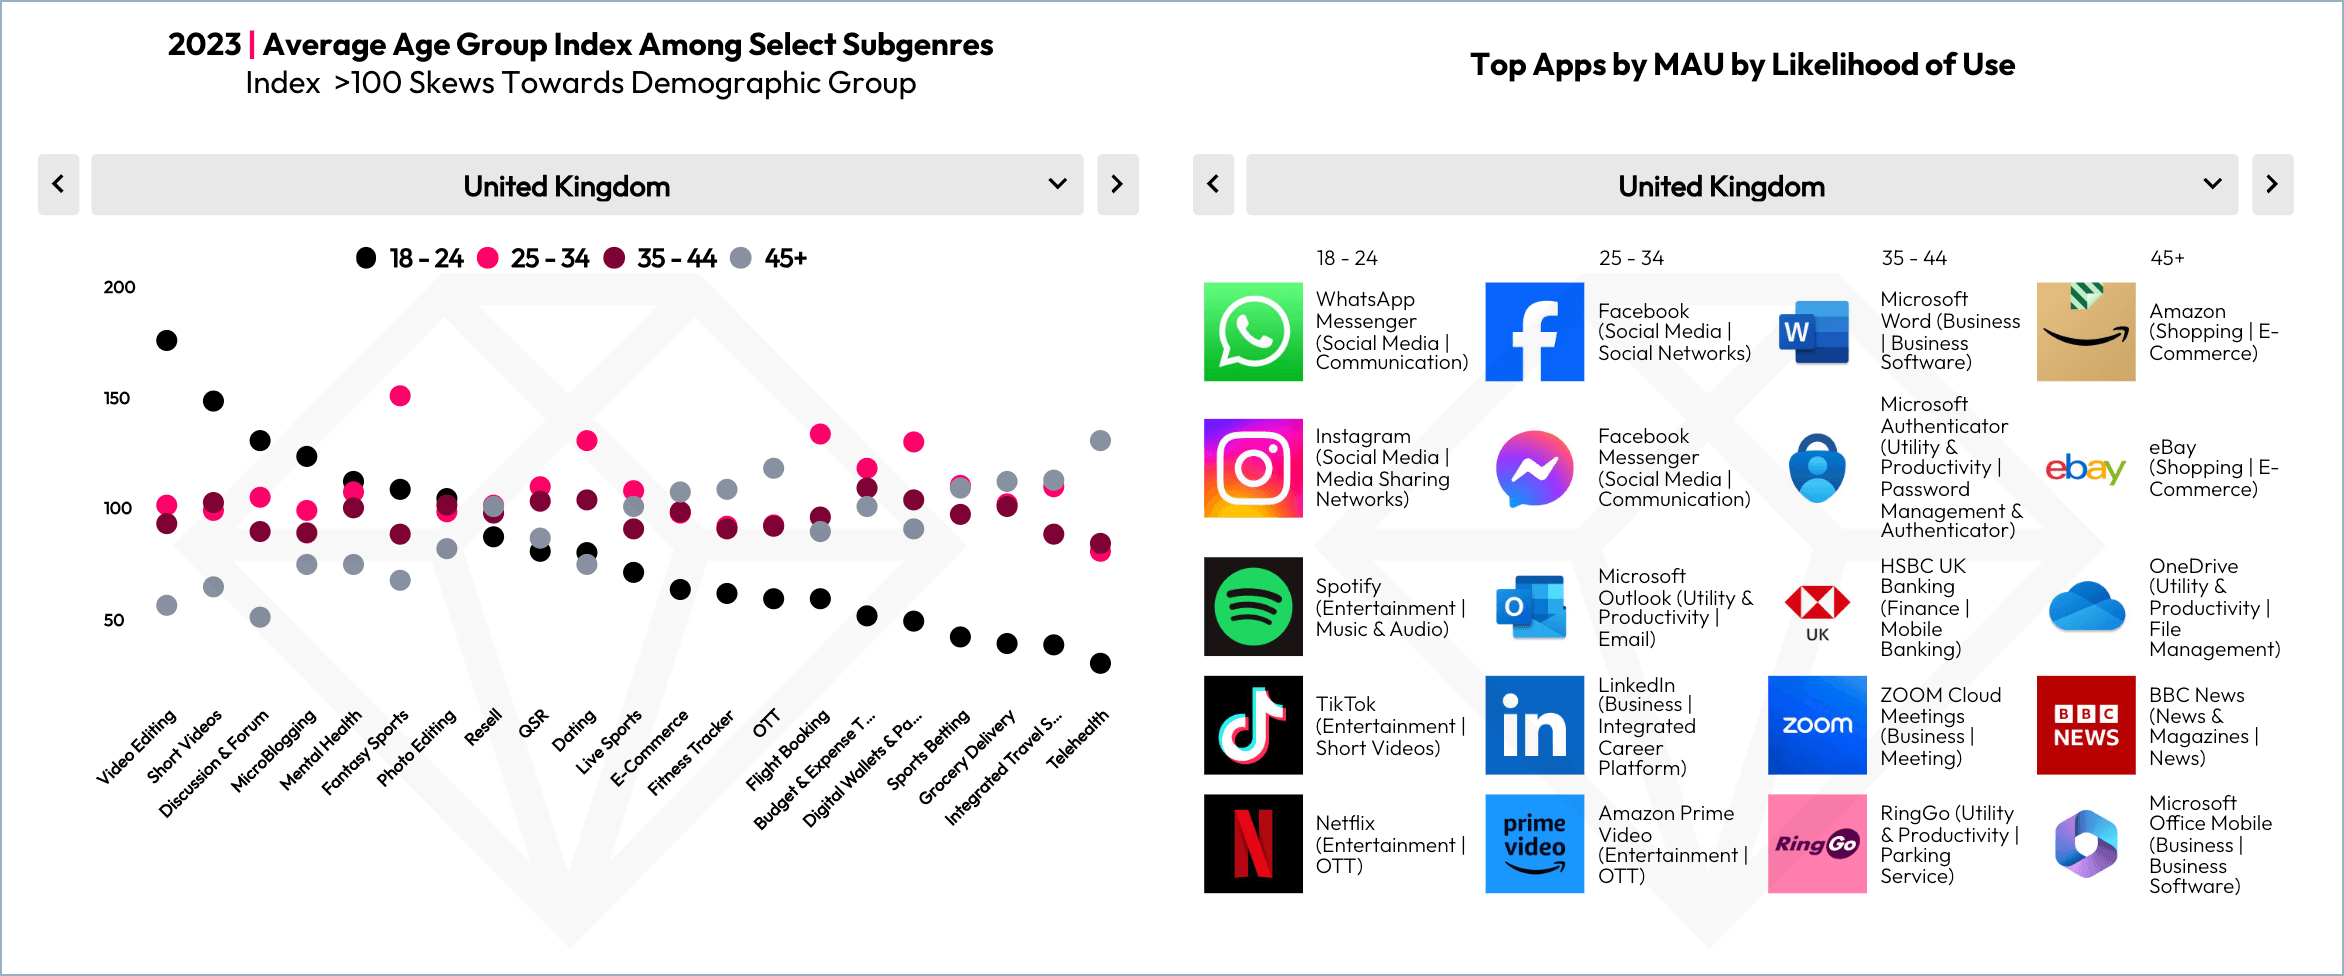
Top mobile app categories - United Kingdom
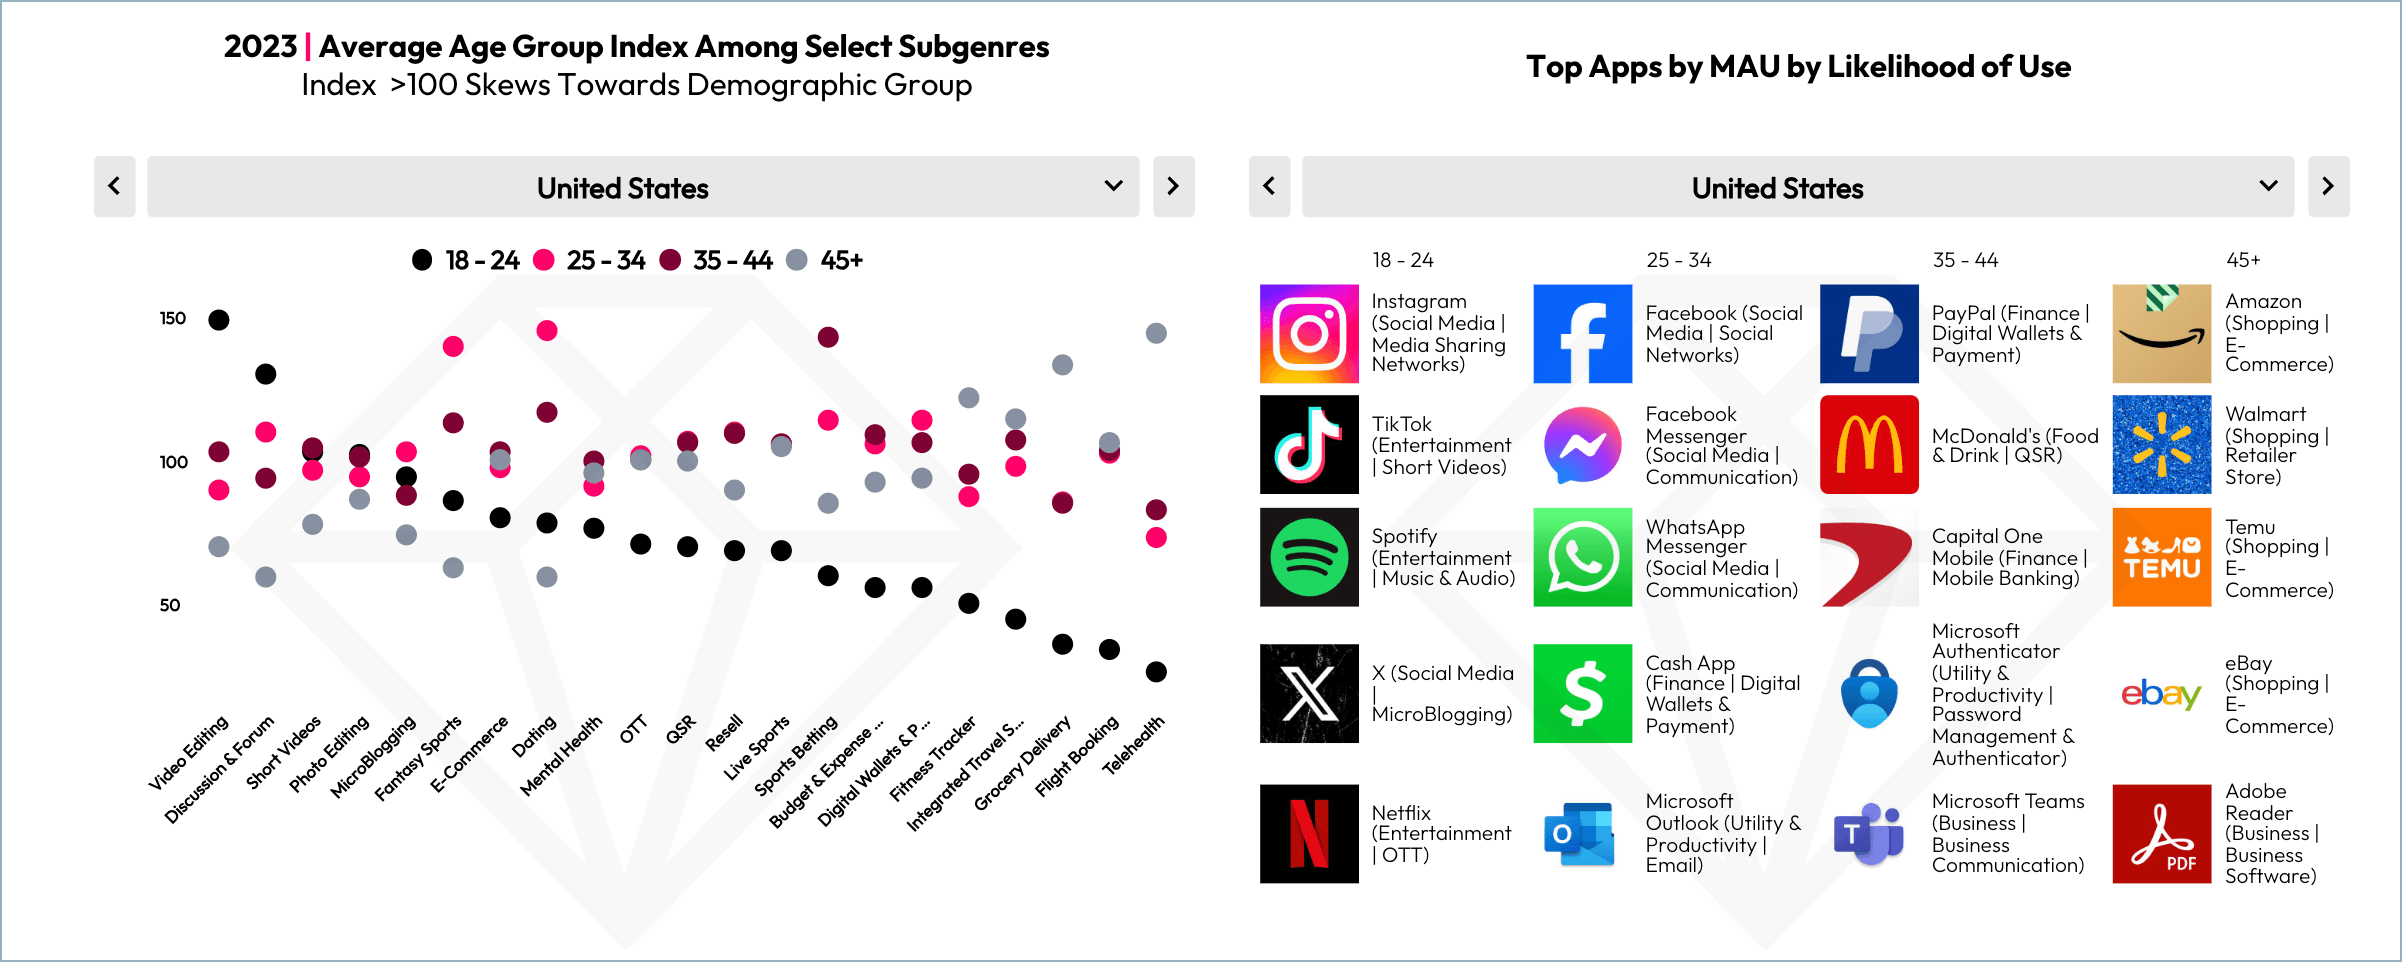
Top mobile app categories - United States
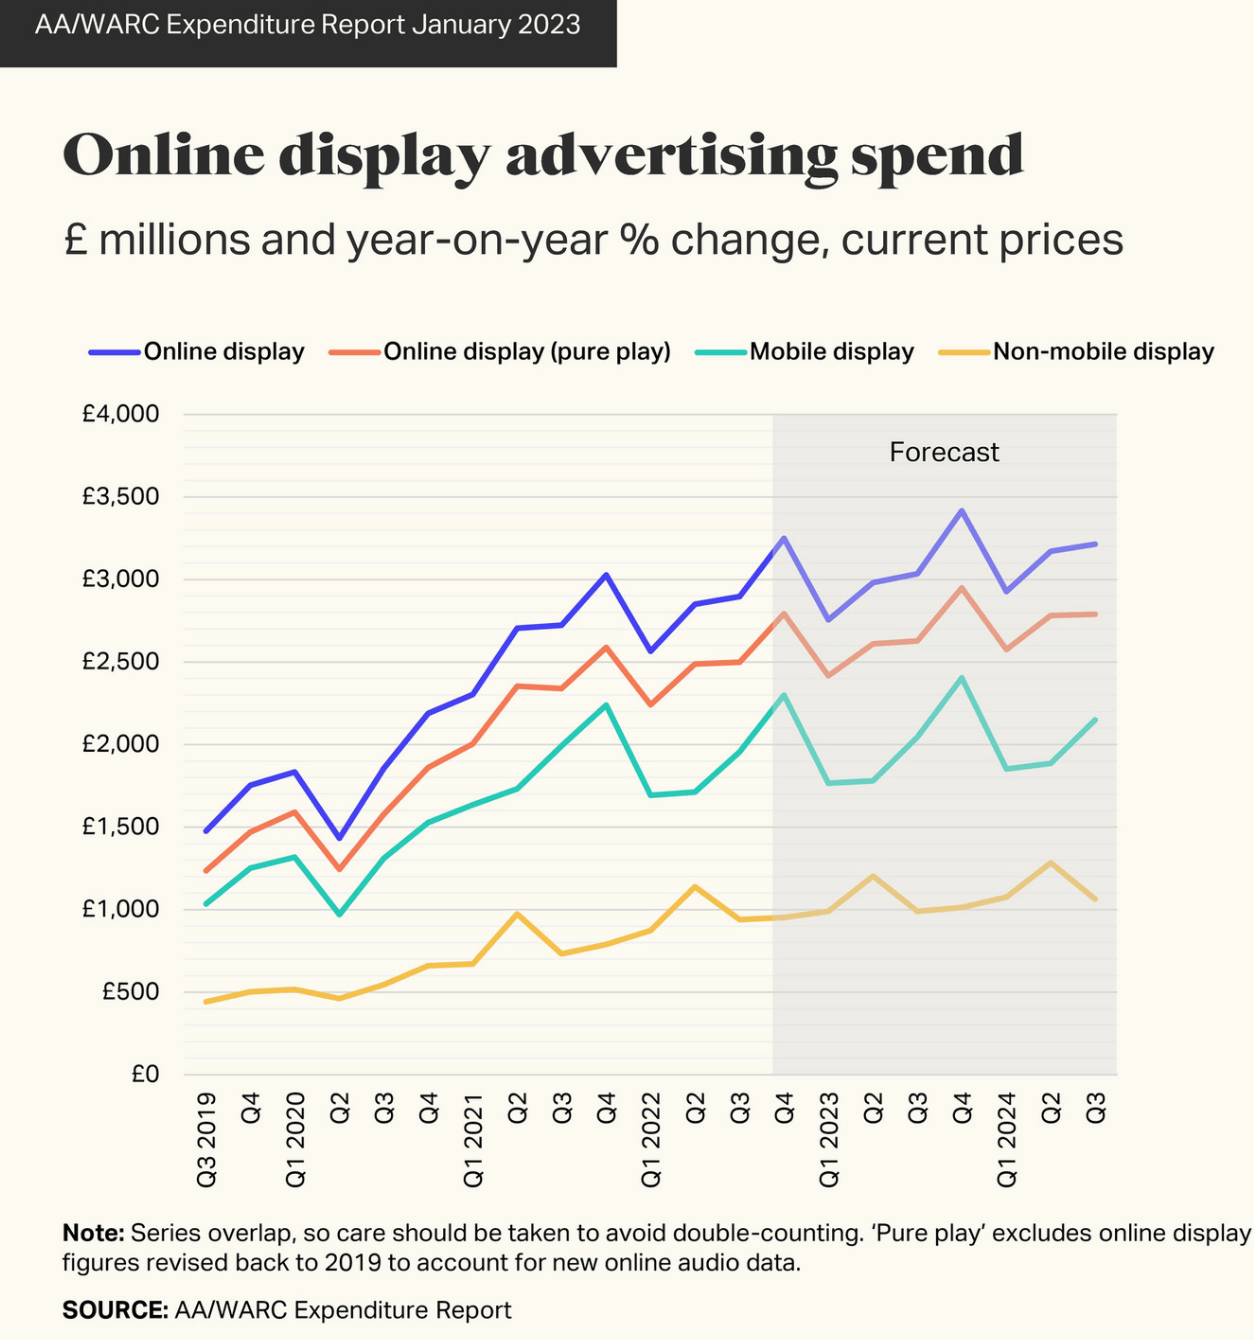
Q6. Mobile advertising stats
So, how have advertisers responded to the change in mobile media time? The next chart from Warc shows that mobile ad spend dominates desktop spend.
The best mobile marketing statistics compilation sources ?
This update to this post features some of the latest updates on mobile statistics and we will continue to update them through the year. But more recent data can be sourced. To conclude we highlight some of the best sources to make the business case for investment in mobile marketing in your presentations and business cases to colleagues or clients.
- 1. Datareportal publishes a bi-annual Global Digital Overview, covering global snapshots of internet usage, social media, mobile phone usage and e-commerce. The report, a collaboration of We Are Social and Hubspot marketing data analysis, comes with key headline figures and takeaways.
- 2. Ofcom Internet usage report. Ofcom’s most recent International Communications Market Report was published last December, this examines take-up, availability, price and use of broadband, landlines, mobiles, TV, radio and post across 17 major countries.
We hope this compilation of statistics about mobile usage and effectiveness continues to be useful - please share if it is and we'll continue to update it.
Free digital marketing plan template
Our popular marketing planning template is structured across the Smart Insights RACE Framework. Join Smart Insights as a Free Member to download our digital marketing plan template today
Access the Free digital marketing plan template