Social media strategy and planning essentials - Recommended dashboards and tools for creating social media marketing reports for different reporting periods
This is part 8 of my Smart Insights 12 part social media series. In the last part we looked at resource planning for social media; in this blog, I discuss what data you should capture and report to measure the impact of your social media marketing campaigns.
To frame the conversation, I’ll cover four different type of report:
- Daily dashboard
- Weekly KPI report
- Monthly roll-up report
- Quarterly strategy review
Reporting scope and goals
It’s important to understand the context, and limitations, for reporting. The data you have access to depends upon your business resources and scale of social activity. For example, many small businesses don’t have subscriptions to social media monitoring tools like Audiense and Buzzsumo, so won’t be able to include data from these in their regular reports. Focus on what data you have available; you can extend later by adding tools or customising analytics.
What you need to report on should be aligned with your social media strategy goals and objectives (see part 2 in this series – “How to create a social media strategy and plan”). For example, if a goal is to increase customer retention by using social media marketing to bring people back to your website, then ensure you have a metric based upon returning visitors.
You also need to differentiate between value metrics (data points that can be used to take action e.g. analysing retweet data can help identify content topics and formats that drive social sharing and brand reach) vs. vanity metrics (data points that indicate engagement but have limited wider impact e.g. likes on Twitter may indicate popularity but increasing likes doesn’t increase content reach like RTs do*).
*caveat – if the only people who RT your content have limited followers and/or are bot spam profiles, then it’s no longer a value metric! Context is everything.
Top tip:
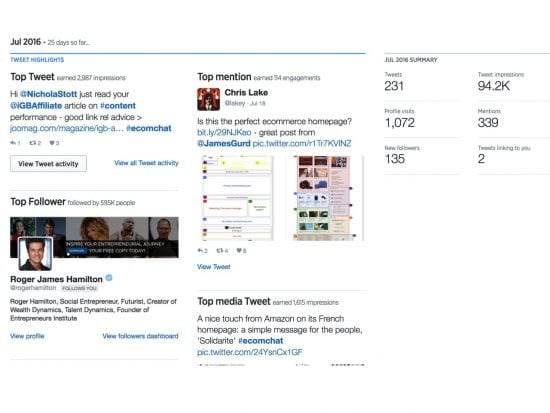
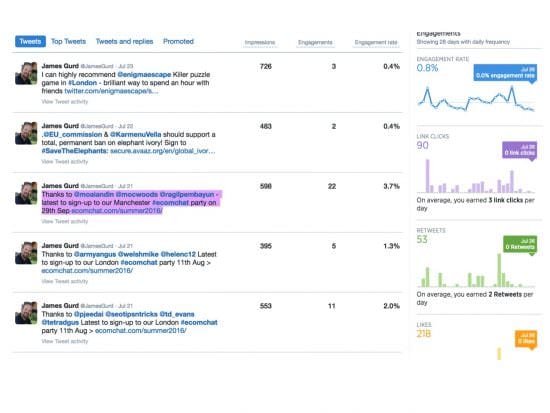
Learn what analytics reports each social network offers. For example, Twitter has a useful ‘Top mention’ for each month, showing the most popular tweet including your twitter handle. You can also drill into engagement metrics for individual tweets, to analyse what type of tweet gets the highest engagement rate or total number of engagements.
Daily dashboard
This is for the social media team, not management, and the aim is to monitor daily fluctuations in activity to be able to spot a change quickly and react. In social media terms, a day is a very long time, so if you see a sudden spike in brand mentions or engagement rate, you need to find out why, fast.
This dovetails with proactive social channel management, ensuring that someone is regularly checking anything posted on the brand’s social networks, as well as brand and product mentions. You don’t want to wait until the next morning to find out if you had a problem the previous day!
I tend to use each social network’s own analytics reports for daily monitoring, or an aggregated view like Hootsuite, from which you can access data on multiple networks (though you’ll need a Pro or Enterprise license to unlock any meaningful data).
Below is an example of the questions I look to answer on Twitter for daily activity:
- Has there been a spiked increase or decrease in followers?
- Have I had a big increase or decrease in engagement levels with my content?
- Have I gained any new ‘epic’ influencers (people with large, engaged follower bases and major influence on other people)?
- Has there been any acceleration in activity for #hashtags I’m following?
- Have any of my key competitors had a noticeable shift in key metrics like follower count?
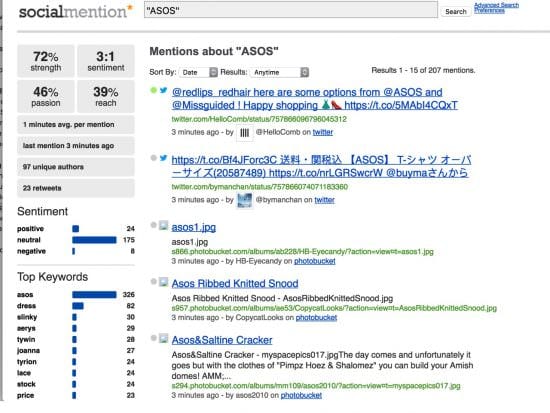
- Has there been a shift in brand sentiment e.g. from positive to more negative?
Detailed sentiment analysis requires subscription to a specialist tool like Meltwater or Trackur, though you can do ‘rough’ analysis using free tools like Google Alerts and Social Mention, albeit with a more limited toolkit.
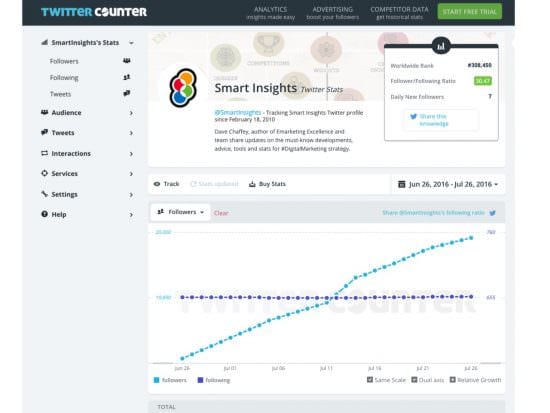
I use free tools like Twittercounter to keep an eye out for follower spikes. The free versions give you limited but useful data to get a handle on trends. For example, the screenshot below shows follower growth over one month for Smart Insights, an easy visual way to spot spikes.
If any of the above questions are a ‘Yes’, I’d analyse the data further to find a logical reason and take action if required. For example, if I suddenly gained hundreds of followers but discovered these were fake/low quality profiles, then I’d ignore the spike as it’s a false reading but I might look into things like my hashtag usage to see if a specific hashtag is attracting bot spam.
Weekly KPI report
Typically I’d set this up in a web analytics tool like Google Analytics and create a custom dashboard, though some people prefer to use custom dashboard tools like Dash.this, which offers periodic, rolling and campaign reports.
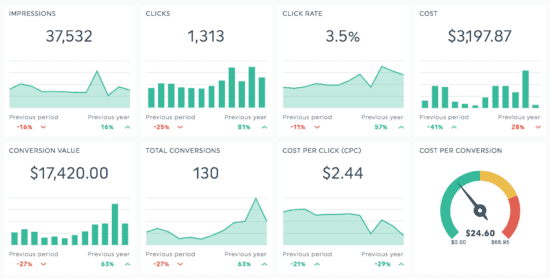
Below is a simple periodic report from the Dash.this blog showing key metrics for each network and comparison with the previous period:
 Another useful report aggregation tool for social media is Klipfolio, which lets you connect all your social channels and then create custom reports and dashboard to give you a customised data view. Below is an example report Klipfolio has created to showcase the flexibility:
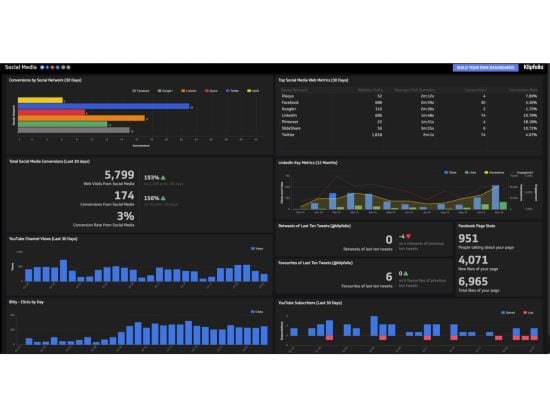
Your weekly KPI report should contain data for each KPI that is aligned with your social media goals. It should be distributed to key stakeholders including the senior social media decision maker. It’s useful to align graphs and charts with 4 different dimensions:
- Acquisition e.g. new visitors
- Engagement e.g. time on page / visit depth
- Conversion e.g. goal completion
- Retention e.g. # return customers
You should also include a comparison of key metrics with the prior week and the corresponding week from the previous year.
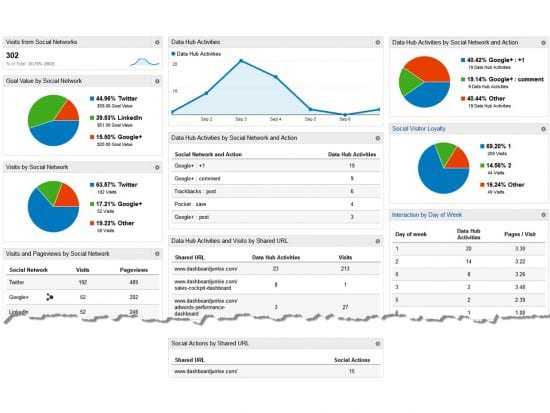
Anna Lewis has kindly created a shared dashboard link on Dashboard Junkie.
Monthly roll-up report
Monthly reports enable an objective performance comparison over a longer period of time for management teams. They show whether upward/downward spikes flagged in weekly reports are trends or isolated incidents. They also help you contextualise external factors that have short-term impact (e.g. unexpected celebrity endorsement of your product), to avoid changing your social media plan based on exceptions rather than the norm.
A monthly report should include:
- Performance vs. last month
- Performance vs. comparable month from last year
- High-level KPI movement including acquisition, engagement, conversion and retention KPIs
It’s common for monthly reports to go to senior management, so think carefully about how much and what to show. The more data you include, the more questions it’s likely to generate.
A few tips:
- Focus on the most important metrics – aim for 3 to 5 maximum
- Don’t include data you can’t explain (“Why has this jumped 50%?”. “ I don’t know” – doesn’t sound good does it!)
- Visualise data to show trends and progress i.e. if this month has dropped but you’re still growing YOY, ensure the chart shows the month is an anomaly
- Tie the data back to overall business goals e.g. if a business goal is customer retention, show growth in website sessions via social media for returning customers
Quarterly strategy review
This is less about metric reporting and more about insight, action and prioritisation. The goal of a quarterly review is to assess how fit for purpose the strategy still is, and what has been learned in the last quarter than should influence planning for the next quarter. This should be a face-to-face meeting, scheduled in advance to ensure people can attend, and include key stakeholders like the head of ecommerce, digital marketing decision makers and customer services manager.
I break this down into the following sections:
- Current strategy focus & goals
Snapshot of high-level goals and objectives, and what social media is focused on achieving in line with overall business goals.
- Progress against goals – KPI delivery
How far ahead/behind of targets is the social media team
- Hits & misses
Highlight big wins and losses, what worked better/worse than expected and why? Strategy reviews must focus on reasons, not just what happened.
- Issues & resolution
What barriers are there to delivering against goals, how do we remove them, who needs to be involved and how will we monitor and report on progress?
- Insight
What have we learned that can help us improve our social media marketing effectiveness, and what information is relevant to be shared across the business e.g. customer insight we can share with Customer Services or vice-versa
- Prioritised recommendations
A list of recommendations that summarise learning and tackle issues and opportunities, prioritised based on how well they each support goals and objectives.
- Next steps and action
A summarised plan of action with defined roles, responsibilities and target deadlines.
I don’t have an example I can share, as all client strategy reviews are commercially sensitive.
Your thoughts, comments and personal experience
So this is step 8 in the Smart Insights 12 step series on social media strategy and planning.
Did you find it useful?
What data points do you include in your social media reports? How often do you generate reports? What data do you find the most useful for providing insight that you can act on?
Please join in the discussion and share your experience in the comments field at the bottom of this page.
Keep an eye out for next month’s article, “Essential tools for social media marketing”.
Missed the previous articles? Catch-up here:
6 reasons why you need a social media strategy
How to create a social media strategy and plan
Competitor analysis for social media strategies
Understanding the role of organic and paid social media
Creating a social media content strategy and plan
Aligning social media with other marketing channels
Resource planning for social media
Thanks
James

Thanks to
James Gurd for sharing his advice and opinions in this post. James is an experienced ecommerce and digital marketing consultant with more than 14 years’ B2C and B2B digital strategy and transformation experience. He is the Owner and lead consultant at
Digital Juggler. You can follow him on
Twitter or connect on
LinkedIn.


