It’s a jungle out there, dog eat dog, and unstructured data is proliferating at an exponential rate. As a marketer you have to be careful, you don’t want to get sucked into this digital Wild West, even the quickest out there could get stung.
Yet, there are opportunities to be had, little nuggets of 24-carat gold that can provide your business with a cutting edge worth millions. Sounds like an opportunity, right?
However, just as the prospectors found it tough trying to make a buck during the 19th century Alaskan gold rush so businesses are finding it increasingly difficult to make sense of how to make big data pay. So even at this early stage of its evolution businesses are asking, what does the future of big data look like?
There isn’t an easy answer but as Shawn O’Neal, VP of Global Marketing Data and Analytics at Unilever, put it at the HAVAS field.work data festival in London recently: 'The number one lesson I’ve learned in 20 years of working in data and analytics and trying to convince people that the data is saying something is that it’s not about the data. It’s about how you tell the story and translate'.
'No matter how good the data is, if you can’t portray it in a human, connected way to business decision makers, it never has an impact. It’s about story-telling. The data could be 1% but it is the nugget that stimulates everything.'
Our own experience at Adoreboard, a data analytics technology spin out of Queen’s University, Belfast, has always been about insights and simplification of data. However, O’Neal’s comments struck a chord to envisage the future for digital marketers by looking at how to data could be transformed in novel ways to tell better stories.
How will data tell an engaging story?
In today's social and mobile world, businesses need to move faster and share knowledge more broadly than ever before. So they need to move quickly but also translate huge amounts of data, which can take time.
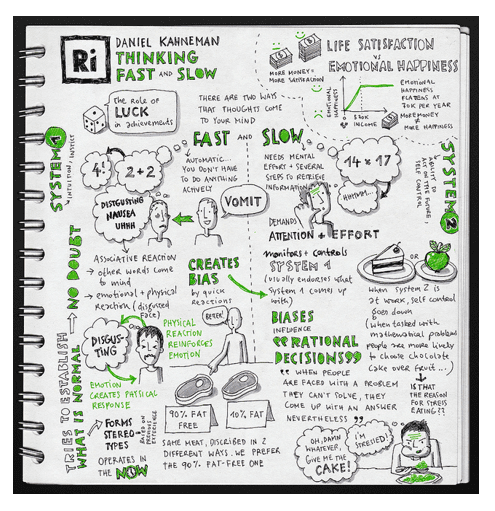
Nobel Prize winner and behavioural psychologist Daniel Kahneman explored the notion that we have two ways of processing data in his book Thinking, Fast and Slow. He theorised that we have two basic systems of thought, 'Thinking Fast’ is unconscious, intuitive and effort-free. 'Thinking Slow’ is conscious, uses deductive reasoning and is high-effort.
Image/Copyright: Eva-Lotta Lamm, Flickr
‘Slow’ likes to think it is in charge, but it’s really the irrepressible ‘fast’ that runs the show, making thousands of decisions and judgements every second.
The problem with analytics is that it’s all about ‘thinking slow’, it requires focus and laborious analysis.
The challenge is to move data analytics from ‘slow’ to ‘fast’, intuitive thinking. Going straight for the gold but armed with the knowledge of 100 geography professors.
In thinking about ‘it’s not about the data’ Adoreboard aims to do is to make it possible for the most sophisticated thinking system in the world to make a decision based on information presented by the best man-made computers in the world.
Copernicus changed the world when he came up with On the Revolutions of Celestial Orbis, yet he only had a limited amount of data available to him in 1543, it was intuitive insight that allowed him to make the imaginative leap and place the sun at the centre of our solar system.
And, we agree with O’Neal, that’s the future of data analytics, presenting the data in such an innately human way that it allows decision makers to make that all important imaginative leap and turn insight into opportunity.
But what does this look like? One of the biggest challenges for digital marketers in the next five years will be to create a bridge for people to understand what the data is saying.
Decision makers need the ability to digest and understand data quickly, often on the move, often through a mobile and definitely within a very short time window.
What if the prospectors of 19th century Alaska had the geographical knowledge that we have now and they could just point a mobile phone at a mountain and the phone translated the data and presented a picture of where the gold was? Maybe that is the future of data analytics.
Let’s look to the future
If the future is not about the data, how can we switch data analysis from thinking slow to thinking fast? Here at Adoreboard we’ve been experimenting with different ways of analysing data to tell stories. In doing so we’ve collaborated with world renowned innovators from Havas helia to Ministry of Sound, here are 3 examples...
Three campaign examples of experiencing and interpreting data
Data visual experience
We analysed how the media and public viewed the highs and lows of golfer Rory McIlroy's eventful year and presented our findings in a full-blown brand sponsorship report (download it for free here) from which we produced an audio-visual data interpretation. From the break-up of his relationship with tennis ace Caroline Wozniacki through to a Ryder Cup victory in September and beyond, we charted and expressed publicly expressed emotion through a 2 minute music and data visualisation.
Data music experience:
What if your brand had a beat, how would it sound and what would you change? Adoreboard teamed up with Ministry of Sound and Havas helia to create a house music interpretation of what Twitter users think about certain individuals and brand names. We used mathematical algorithms for 20 emotions expressed in tweets that turn them into melodies and rhythms. So feelings such as love, hate, anger, surprise, annoyance and trust each create their own individual sounds.
Data avatar experience:
Through collaboration with Cantoche, a French base specialist in avatars, we created a virtual media assistant who could process the emotions expressed online and convert this into a facial expression. Facial expressions are something we, as people, have a natural ability to instantly interpret - it’s amazing how quickly we can understand something without communicating through words.
https://youtu.be/E3Valq-VV5w
It’s not all about the data
As a wise man once said, it’s not all about the data. If you can’t portray it in a human, connected way to business decision makers it never has an impact.
What are your thoughts? How can we move data understanding from thinking slow to thinking fast, so as to speed up the process of data understanding? How can data be portrayed in a more meaningful, humanistic way, appealing to the visual, auditory and kinesthetic communicators?
Thanks to Chris Johnston for sharing his advice and opinions in this post. Chris is CEO of Adoreboard. You can follow him on Twitter or connect on LinkedIn.
By Expert commentator
This is a post we've invited from a digital marketing specialist who has agreed to share their expertise, opinions and case studies. Their details are given at the end of the article.
 Thanks to Chris Johnston for sharing his advice and opinions in this post. Chris is CEO of


