How to increase communications relevance through more personalised, contextual messages based on customer insight

Data is the key to understanding your customers and delivering new insights, but data in itself is just a series of 1s and 0s until you can bring meaning and interpretation.
Knowing and understanding your data is the first step in delivering relevant communications and customer value, as you turn raw data into information and then actionable insight. Starting this journey however can be a difficult step as highlighted in the 2013 Teradata Data-Driven Marketing Survey which stated:
‘Nearly 50 percent of marketers agree that data is the most underutilised asset in their organisation, with less than 10 percent saying they currently use what data they have in a systematic way’
Where to start?
There are several ways to data discovery and data auditing. These vary from reviewing existing documentation on data repositories, existing systems and solution architectures to performing a series of interviews with each business area to identify data areas used globally within the business and locally by department/team. A good tactic is to use existing knowledge of your customer’s journey to identify the areas providing actual and potential data to your business.
This can begin with looking at the different channels employed during your customer’s journey with you, breaking them down by the key channel types:
- Purchase Channels
- Marketing Channels
- Fulfilment Channels
- Research Channels
- Post Purchase Channels
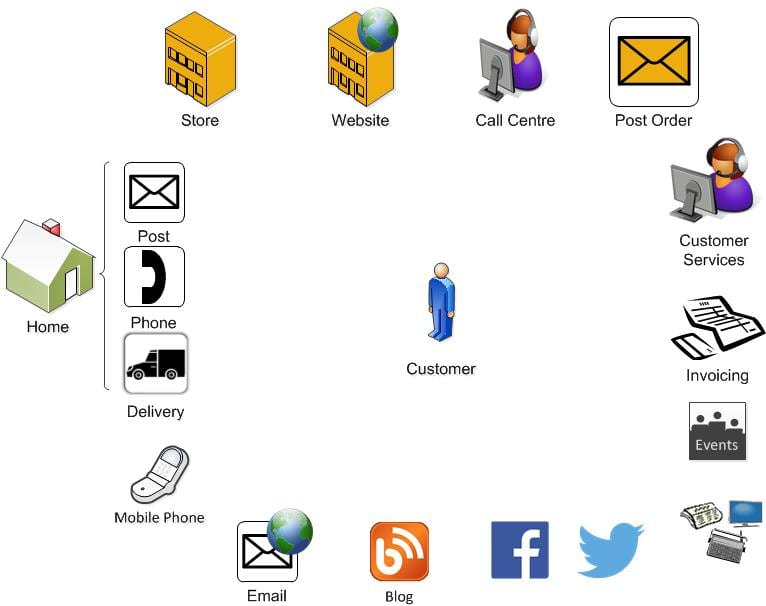
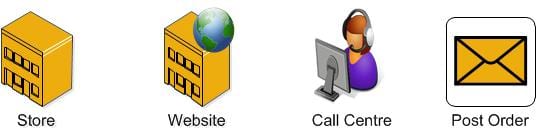
Starting with the purchase channel, a typically well understood touch point with your customer, this should cover areas such as those defined in below.
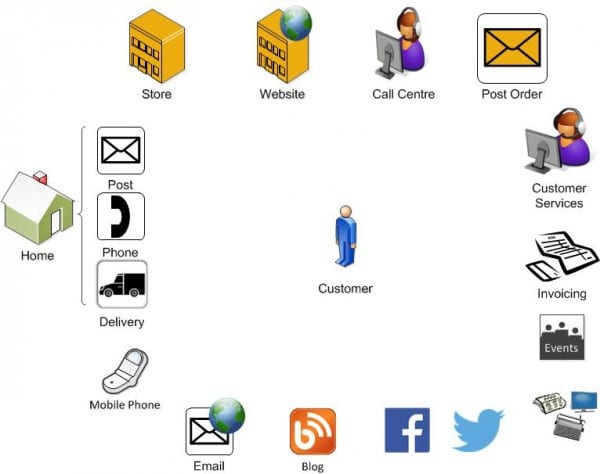
Working through these channel types will provide the first part of your data picture, enabling a high level view of the touch points a customer has with your business or you would like them to have, providing a starting point to knowing your data as shown below.
What is the quality of our data capture?
Once you have an awareness of your touch points you then need to move on to see if you are capturing data at all of the available customer touchpoints. This can again be quite a time-consuming activity, so start small and try to answer the following questions about each touchpoint:
- Are you able to measure the touch point at some level, in terms of success, volume of activities, value of activities, etc. In general terms are any reports/ad-hoc analysis available on the touch point.
- Do you know how to access the data provided from the touch point?
- Do you know what data characteristics are provided from the given touch point at a high level?
- Identity Data – Information identifying the individual (e.g. name details).
- Quantitative – Measurable operational data (e.g. transactional information).
- Descriptive – Additional profile information on the individual (e.g. lifestyle details).
- Qualitative – Attitudinal, Opinion and Motivational information (e.g. ‘why was the product purchased?’).
- Is the access method to the touch point data an approved standard approach used by all users of the data?
- Do you have an understanding of all the data provided in the touch point, in terms of available content, possible values and value meanings? (e.g. Gender = 1, means ‘Female’). In general terms do you have a data dictionary or equivalent details provided in the data access system?
If you have answered yes to any of these questions, then data is being collected, it may not be in an easily accessible, centralised and validated form, but the data collection process has begun for that given touch point.
Build a picture of your data awareness?
Using the information gathered in the first two parts of this article enables a business context diagram, shown below, to be built. Providing a visual representation of your business and the data you use from the view-point of your customer journey, enabling you to quickly see the areas of pain and the complexity of the existing solution with your level of data awareness.
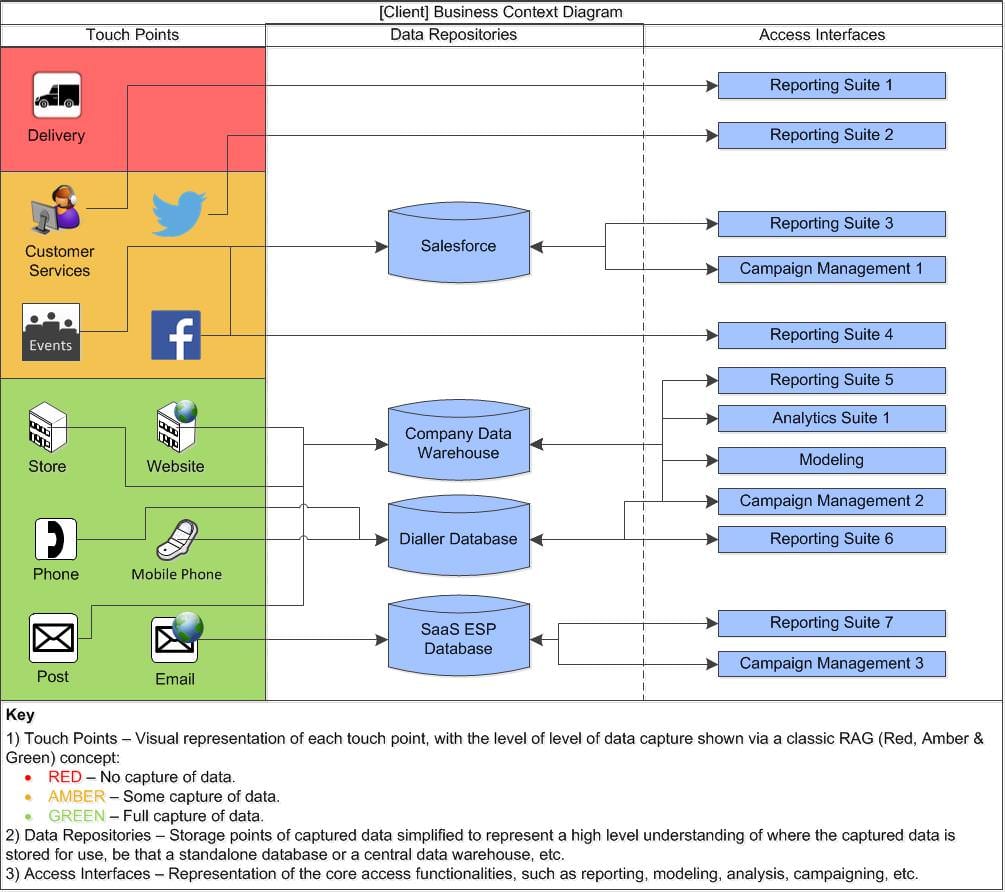
In an ideal world this diagram would have all touch points in the Green section, connected to a single data repository with all functional needs accessing that repository. In reality this is rarely the case and you will end up with a version looking like the example above.
To follow a detailed process and understanding of your data and improving how it is managed and used in your business, take a look at our new Expert members guide: “Managing Customer Data to Improve Marketing ROI”.