A case study example of applying the Smart Insights RACE framework to measure customer engagement and marketing success
You probably already use—or at least have thought about using—some form of marketing dashboard to track and manage your analog and digital marketing KPIs (Key Performance Indicators). But how has it impacted your decision-making ability concerning customer engagement? And do you effectively leverage that data to help you manage all the most important marketing factors that drive success for your organization?
I subscribe to the basic premise behind the Smart Insights RACE (Reach, Act, Convert, Engage) framework for organizing and tracking digital marketing KPIs as they relate to customer engagement, but I’ve expanded it to include analog marketing activities as well.
[Editor's note: Since Kent Huffman wrote this post, Smart Insights have created a RACE dashboard based on Google Analytics to automatically display month dashboards]
In this post I'll explain how I have been applying the RACE marketing framework as part of an integrated model for my marketing dashboard at BearCom Wireless over the past few years and have been very pleased with the actionable insights it has provided. Although the application of the various elements will necessarily vary from company to company, if you follow the basic structure laid out in part two of this blog post, your dashboard should yield similar results for you.
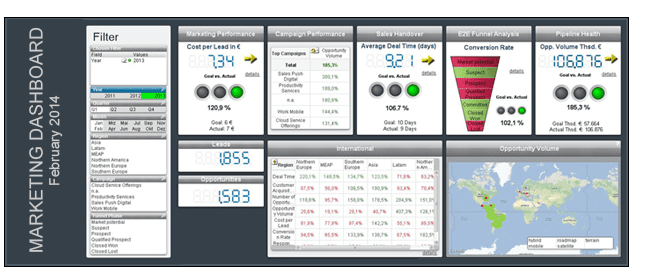
Organizing and presenting the metrics for your dashboard
I’ve found that the best way to organize and present the metrics related to the performance of my marketing initiatives is to relate them to the customer engagement process. That way, everyone who is exposed to the marketing dashboard understands not only which metrics have been incorporated, but how they impact customer experience, and as a result, the bottom line. This is where the RACE framework really shines.
A visual depiction of the RACE Digital Strategy framework developed by Dr. Dave Chaffey and his team at Smart Insights looks much like a traditional sales/marketing funnel, with stage 1 at the top and stage 4 at the bottom. But before we explore how those stages relate to your marketing dashboard and customer experience, let’s begin with a short discussion of one of the most difficult marketing topics to accurately measure: brand equity.
Including Brand Equity metrics
Dr. David Aaker, a renowned marketing professor and brand consultant, highlights 10 attributes of a brand that can be used to assess its strength. These metrics should be review for relevance to your dashboard. They include awareness, differentiation, personality, leadership/popularity, perceived value, organizational associations, satisfaction/loyalty, share of market, profit margins, and distribution coverage. Dr. Aaker doesn’t weight the attributes or combine them in an overall score, as he believes any weighting would be arbitrary and would vary among brands and categories. Rather, he recommends tracking each attribute separately.
Depending on the size and type of the organization you work for, measuring brand equity using all—or even some—of these attributes may be difficult or even impossible. But do the best you can, as tracking the value of your brand is an important element of the overall picture of your brand’s health.
Applying the RACE Framework to create a dashboard
Now back to our discussion of the RACE framework
Stage 1: Reach
This initial phase in the customer engagement process is where your prospects are conducting research and exploring their options. Your primary goals should be to publish quality content and use effective direct marketing techniques to build awareness of your brand, products, and/or services. The KPIs associated with this step for different media channels include:
- Analog marketing
- Advertising
- Impressions
- Response rate
- Cost per conversion
- Direct mail
- Delivery rate
- Response rate
- Cost per conversion
- Trade shows and other events
- Registration
- Attendees
- Satisfaction
- Public/media relations
- News releases
- Journalist inquiries
- Interviews
- Pickups/coverage
- Positive mentions
- Endorsements by journalists/influencers
- Share of voice
- Digital marketing
- Website and blog
- Search engine optimization effectiveness
- Pay per click advertising efficiency
- Impressions
- Cost per click
- Cost per conversion
- User sessions
- Webinars
- Attendee rate
- Drop-off rate
- Engagement rate
- Conversion rate
Stage 2: Act
During this phase, it’s all about persuading prospects to start interacting with your brand and begin making buying decisions.
Your primary goals should be to continue publishing content and using direct marketing techniques, but also to engage directly with your prospects—online and offline.
In addition to the KPIs associated with stage 1, you should include:
- Analog marketing
- Digital marketing
- Website and blog
- Subscribers
- Backlinks
- Time on site
- Downloads
- Social media
- Engagement: likes, shares, retweets, comments, etc.
- Sentiment
- Conversions
- Leads
Stage 3: Convert
During this phase, your prospects become your customers.
Your primary goals should be to generate purchases and integrate various nurturing, marketing automation, and remarketing techniques to ensure relevance and drive repeat sales.
In addition to the KPIs associated with stages 1 and 2, you should include:
- Digital marketing
- Website and blog
- Return visitors
- E-commerce transactions
- Leads
- Orders
- Revenue from purchases
- Average order value
Stage 4: Engage
During this phase, your focus should be on creating repeat customers and leveraging your relationships with those customers over time.
Here is where you build and expand customer engagements and measure customer lifetime value, not only from individual customers, but from the value of the customer advocates you’ve created.
In addition to the KPIs associated with stages 1, 2, and 3, you should include:
- Digital marketing
- Website and blog
- E-mail
- Open rate
- Click-through rate
- Bounce rate
- Unsubscribe rate
- Social media
- Orders
- Revenue from repeat purchases
- ROI
- All marketing campaigns and initiatives
- Customer lifetime value
The Bottom Line
As you build your marketing dashboard, incorporate as many of the elements as possible from the four stages of the RACE framework detailed above. And tie your dashboard as closely as you can to the customer engagement process, as doing so will make it more meaningful not only to you, but to the rest of your organization as well.
When it’s all said and done, the impetus for creating and using a marketing dashboard should really be about measuring results—effectiveness, efficiency, and bottom-line ROI—not just activity. If at all possible, make your dashboard available publicly, and tie the goals to the compensation program for your marketing team. You’ll be amazed how that will help drive marketing and sales alignment, as well as the specific results most important to your organization’s success.
Before I look at this First, a few thoughts about Marketing Metrics and Analytics
5 lessons to improve metrics and performance
Creating the Dashboard is only the beginning of using it to improve the business - it's how it's used for decision making that is important. It's as well to remember these five key lessons suggested by Marketo to improve your performance, profitability, and credibility with marketing metrics and analytics:
1. Plan for future success:
- Reporting for reporting’s sake is less important than the decisions reports enable to improve profits, so find not just what works, but what works better. Focus on improving ROI, rather than just proving ROI.
- Set goals and run scenarios for all marketing programs—prior to spending money.
- Design all programs to be measurable.
- Apply the insights from prior measurements in the current cycle of planning.
2. Maintain financial integrity:
- CEOs and CFOs care about growing revenue and profits, so use the hard financial metrics they value to build credibility.
- Be comprehensive in accounting for all marketing-generated costs.
- Model the stages of your revenue cycle. Understand your lead flow, conversion rates, and speed of closing sales.
3. Measure strategically:
- Identify measurement priorities in advance of campaigns, and incorporate campaign-specific measurements into the planning process.
- Integrate diverse measurements to determine how to best leverage the unique strengths of each methodology and to allow multiple measurements to have a cumulative effect.
- Delve into all expenses involved in customer value, and improve the profit potential of each individual account—and improve targeting for new accounts.
4. Create an environment to succeed:
- Enable access to critical marketing, sales, and financial data. Employ tools to display what’s urgent, important, and relevant.
- Implement marketing technologies to use staff and marketing assets more efficiently.
- Enhance data analysis capabilities to advance precision of ROI analyses.
- Train and hire experienced, tech-savvy people with a bias for experimentation.
- Create a virtuous cycle of communication with your C-suite.
5. Cultivate a culture of continuous improvement:
- Establish a roadmap for increasing marketing ROI and measurement capabilities over time.
- Develop a process that aligns marketing and measurements to sales and business objectives.
- Run pilot initiatives to introduce new capabilities.
- Build momentum by acting on insights for initial wins.
- Continuously evolve the marketing ROI process—it’s a journey, not a destination.
A final thought, well known, but worth repeating:
“What gets measured, gets managed.”
Peter Drucker

Thanks to
Kent Huffman for sharing their advice and opinions in this post. Kent is Global Vice President, Marketing of Servergy and author of
8 Mandates for Social Media Marketing Success - read his updates and book details on this
blog. You can follow Kent on
Twitter or connect on
LinkedIn.


