How marketers are using analytics wrong and how to fix it
Google Analytics is one of the most powerful tools for marketing analytics. However, it is also one of the most underutilized tools - the amount of data and information it provides can be overwhelming, and users often have to spend hours tweaking their segments before finding any use in their data.
To solve this problem, we set out to build a data science algorithm that turns that data into actionable insights. We thought it’d be a straightforward task.
We had no idea about rabbit hole it would lead us to, the nuances we would have to factor in, and how working with hundreds of brands and agencies would allow us to see that it’s not only a data problem, but also a psychological one.
Marketers are human. Our views are biased, our thoughts have fallacies, and our teams have constraints. Coupled with only data that supports our hypothesis and not against, we could be even me more confident even when we’re wrong.
The following are 4 common psychological pitfalls that marketers fall into and how you can avoid them by becoming more data driven.
1.Confirmation Bias
“Still, a man hears what he wants to hear and disregards the rest” - Paul Simon, The Boxer
After hearing many industry experts rave about retargeting, a user thought retargeting would work for them. They created retargeting ads to get users who visited the site to come back, then looked at how many leads it brought them (24%), and concluded that their retargeting campaign was effective.
It wasn’t.
The user forgot to account for the cost of running the campaign, and that the campaign mostly targeted returning visitors who would have otherwise come back through email campaigns. They did not look for evidence against their hypothesis.
One of the easiest traps marketers fall into is confirmation bias - we believe something is true, and look for evidence to support our claims.
As humans, we do this all the time. And while we can’t stop this from happening, we can make efforts to mitigate the effects.
Look for evidence that disagrees with your claim.
After you arrive at your initial conclusion, say, Facebook Ads are effective in bringing enterprise customers to your site, look for evidence that disproves it. Do it actively. Don’t spend hours building your case and 5 minutes building against it. Figure out if your case applies seasonally, only to users originally from a particular channel, or to a subset of your customers.
Make the commitment to accept the facts if they point to another direction
This is what separates having an effective marketing team and an ineffective one, the companies who are data-driven and the companies who use analytics because “everyone does it”: If the data suggests that your hypothesis is wrong, revise your hypothesis.
Even for inbound and SEO, where efforts take 6-8 months to pick up, it is important to set expectations in the timeline (a 20% increase in organic traffic in 6 months) and judge your progress. If the goal is not met, then as painful as it is, admit that it’s not working, and revisit your strategy.
2. Have fewer goals
One of our users thought the more Twitter mentions and retweets they had, the more leads they would get. After a year, they grew to have a large following. Posts were often retweeted and favorited multiple times.
Revenue must have increased, right?
Nope. It turns out the users who retweeted and the followed were not the users who bought. Very few contributed to revenue.
Key Performance Indicators (KPIs) - things like bounce rate, pageviews, and users - are often utilized, most of the time on a dashboard. The reason why we have KPI’s is because humans can’t keep track of thousands of metrics and millions of correlations.
KPIs solve this problem because as opposed to checking every permutation, we can make educated guesses. An increase in transactions (and retweets) is usually positively correlated with an increase in revenue; if revenue decreased, it’s probably because of one of the KPIs performing worse.
The problem arises when we give all the KPIs the same significance, and try to optimize for all of them. Optimizing for 17 goals isn’t optimizing at all.
Sometimes a decrease in transactions would increase revenue, and sometimes having more Facebook shares might mean less lead generation. When encountering conflicting KPI data, it’s important to understand which metric is more important and focus on improving that. Otherwise, you may be chasing a vanity goal.
The best way to see which metric deserves the most attention is through statistics. In the case of our analysis, our algorithm looks at your end goal and determines which metric by looking at 16 million permutations of your data.
How to pick your goal
To choose the right goal, be able to easily articulate what your website is for. Sure, you might have a site that’s viewed by millions of different visitors, but it’s important to know what you want most users to do on each page.
If you want to optimize for lead generation, “how long they spend on your page” is less important than “how many filled in the lead generation form”. If you want more views from new users, “new unique users” is more important than “newsletter subscription”. Pick wisely, and focus on that.
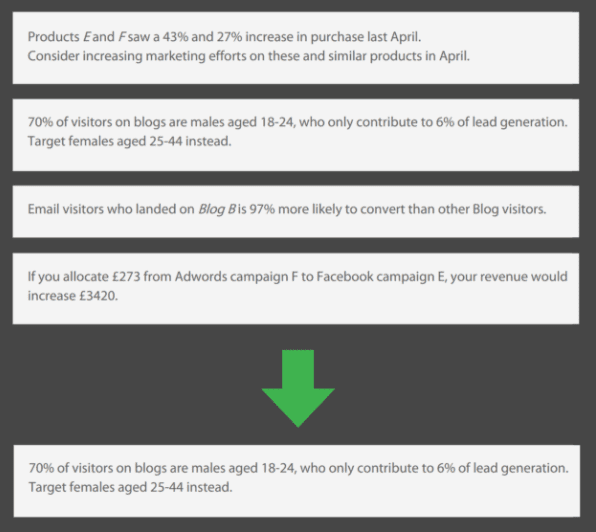
3. What you don’t show is just as important as what you show
When we first built our data science algorithm, it spat out thousands of insights. And it made sense - you can find a relationship between any two points.
But it is important to distinguish a weak correlation from a strong one, and also understand that correlation does not imply causation.
Every marketing team has constraints. We can’t do everything, so the important thing is to figure out what’s important. In developing our algorithm, we had to think hard about the principles behind every recommendation we gave out.
For example, while a faster page load speed can increase conversion rate significantly on some sites, on others it would barely affect it. It would not make sense to show a recommendation for the latter case, so we removed it from our reports.
A 5% increase for a site with 10 million monthly visitors is substantially more important to note than for a website with 2000 visitors. Larger companies usually also have more resources to implement new strategies, so we can give them more recommendations.
Another thing to factor for is what marketers can control. You cannot affect what time of day Google Organic users come to the site, but you can have time-specific promotion, unique landing page, or have a specific call-to-action when they come to the page.
These are just a few factors. As a marketer, you can send out thousands of different recommendations, but knowing which ones to pick and which ones to leave behind can separate a successful marketing strategy from an incoherent one.
4. Bonus: Connect your data sources and clean up your data before analyzing
You cannot turn bad data into meaningful analysis.
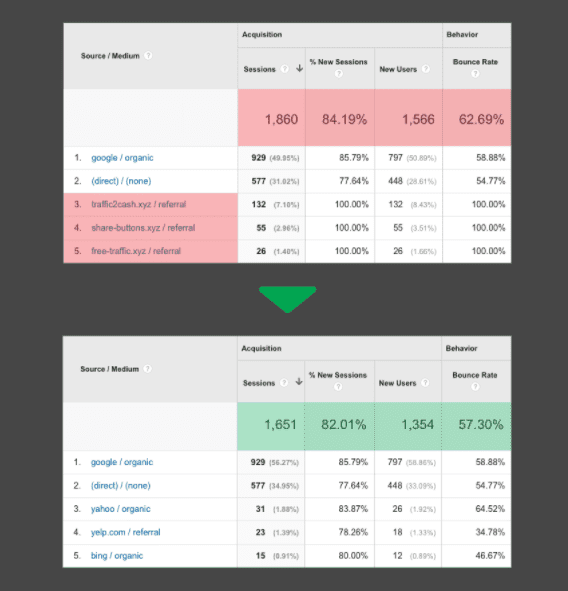
Remove spam bots and fake traffic:
Chances are, you’ll see visitors from sites like 'social-buttons.xyz', 'top1-seo-service.com’, or even ‘vice.com’, but that those users display odd behaviour, like spending no time on your site. These visitors are spam bots. Doing analysis on a bad data set is meaningless.
Luckily, it’s quite easy to remove them. Luckily there is a free tool that automatically install filters and updates when new spam bots show up. You can also remove them by manually adding filters - it’s important to keep the list updated to prevent new spam bots (they adapt).
Connect Ad cost data to Google Analytics:
All the data in the world is useless if you don’t consolidate it. If Google Analytics is not connected to Adwords, you won’t be able to connect what a user does before they converted, and which keyword brought them to your site. Connect them!
You can also connect Facebook and Twitter ads data by uploading the spreadsheets. If that’s too much hassle, PaveAI users can automatically connect ad data with analytics.

Thanks to Eric for sharing their advice and opinions in this post. Eric Ho for sharing their advice and opinions in this post. Eric Ho is a cofounder of
PaveAI, a Y Combinator-backed startup that turns web analytics data into actionable insights. You can follow him on
Twitter or connect on
LinkedIn.


