Compelling visuals are key to creating content capable of cutting through the noise
The direction of the internet will forever determine the direction of the business world. And as the internet becomes increasingly visual, businesses are being forced to turn to visualizations in everything they do. Instead of pushing against the grain, it’s time that you fully invest in visualization this year.

The Visual Nature of the Internet
If you study the history of branding, media, and the internet, you’ll notice that they’ve followed a similar path. Text and written content once served as the backbone for these specialities. Now it’s visuals – images, videos, and graphics.

Back in the spring of 2010, entrepreneur Bill Dalessandro wrote an article about the amazing transformation media had undergone from the 1950s through the 2000s. He wrote openly about the increasingly visual nature of the world and the bright future ahead. At the time, social media was still largely in its infancy, the iPad had yet to be released, and “big data” and “cloud” were unfamiliar terms to the general public.
Now, in 2016, we can look back at the past six years and confidently say that the business world has become even more visual than it was in April 2010. This has been largely fueled by growth in social media, content marketing, and advertising.
We’re seeing companies across all industries investing in visual tools and solutions to engage their audiences and stay competitive. For example, Shopify recently released a free logo generator tool to help people design simple logos on an intuitive platform. Each year over the holiday season, Office Depot sponsors the popular ElfYourself app that lets people create custom video features. Companies like HubSpot are constantly releasing free marketing resources and design templates.
Brands recognize the direction of the business world and are quickly adopting new techniques and approaches that make visuals a priority. Not surprisingly, the growth in marketing and advertising has had a trickle-down effect in the data and analytics world.
The Importance of Data Visualizations in 2017
As the demand for robust visualizations in the business world grows, so does the importance of big data and analytics. It makes sense, then, that the two would converge. If you’re going to collect lots of data, then you must find a way to create visual representations that are digestible and easy to follow.

“We understand and retain information better when we can visualize our data. With our decreasing attention span (8 minutes), and because we are constantly exposed to information, it is crucial that we convey our message in a quick and visual way,” writes Norman Shamas of TechChange.org.
In the past, insights would frequently be overlooked, but Shamas points out that this is no longer the case. Thanks to new data visualization tools, it’s possible to create meaningful displays of data.
“Patterns or insights may go unnoticed in a data spreadsheet. But if we put the same information on a pie chart, the insights become obvious,” Shamas points out. “Data visualization allows us to quickly interpret the data and adjust different variables to see their effect and technology is increasingly making it easier for us to do so.”
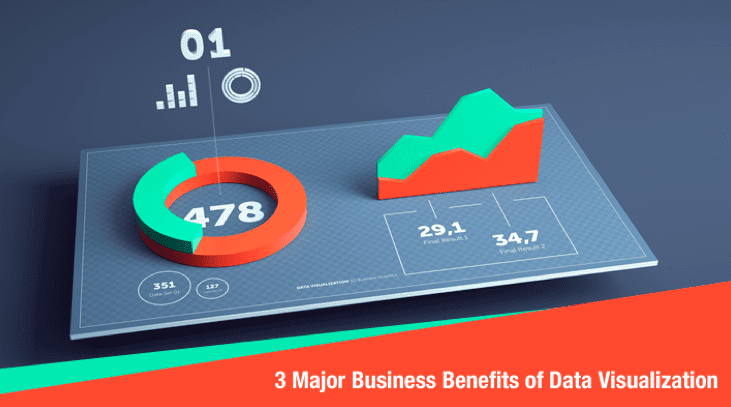
3 Major Business Benefits of Data Visualization
Moving forward, data visualizations aren’t selectively reserved for only large enterprises and wealthy organizations. This year, for the first time ever, we’re seeing small businesses and organizations of all shapes and sizes invest in data visualization. While every business has its own unique goals, many are doing so in order to experience the following benefits:
1. Better Understanding of Information
Even for data scientists and mathematicians, trying to digest large quantities of numbers and statistics can be challenging. The human brain is designed to absorb information visually and spreadsheets don’t always do our cognitive processing justice.

“By visualizing information, we turn it into a landscape that you can explore with your eyes, a sort of information map,” data expert David McCandless told his audience during a TED Talk. “And when you’re lost in information, an information map is kind of useful.”
There’s no better way of putting it. Data visualizations are visual information maps that concretely connect the ideas, truths, and trends that are cemented deep within numbers, spreadsheets, and raw data. When you make an investment in data visualizations, you’re making an investment in better understanding.
2. Ability to Forge New Connections
One of the single biggest benefits of data visualization is how it allows you to see connections as they occur between various operating conditions and business performances. This allows you to move beyond looking at the organization as a fragmented set of operations and instead encourages you to view it as a symbiotic organism with valuable patterns and relationships.
3. Quick Identification of New Trends
Finally, data visualizations allow businesses to quickly identify new trends as they develop. In a time where trends can change at any given moment, it’s imperative that you’re able to study developments in real time. Data visualizations let you view multiple data sets and quickly spot trends that can then be acted upon for tangible decision making. It’s the opposite of playing “catch up.”
Make Visuals a Priority
In 2017 and beyond, data visualizations need to be an organizational priority for businesses of all sizes. For years, we’ve seen the impact visualizations have had on marketing, advertising, and branding. It’s now time for companies to begin leveraging visualizations when it comes to data. There are many benefits to be garnered from such a disciplined investment, and you should be one of the first to enjoy them.


