Using customer surveys and feedback data as part of a methodology for improving customer journeys
If you want to improve your customer’s experience, listen to what your customers are saying.
Like any cliché, it is easier said than done... Over-simplification can be misleading and it misses the most important point: what are the drivers for customer to follow the path-to-purchase?
If you want to improve your customer experience you need to be focused on the path or the journey and the reasons behind it. Along the way you may find that some aspects you previously considered as the only way to do things are actually not enough. Marketing automation is not enough.
As shocking as it seems for some of us, many businesses worldwide still prioritise outbound marketing and customer acquisition; by speaking at customers, rather than inbound marketing and retention; actually listening to what customers are saying with the objective to provide a good experience based on insights.
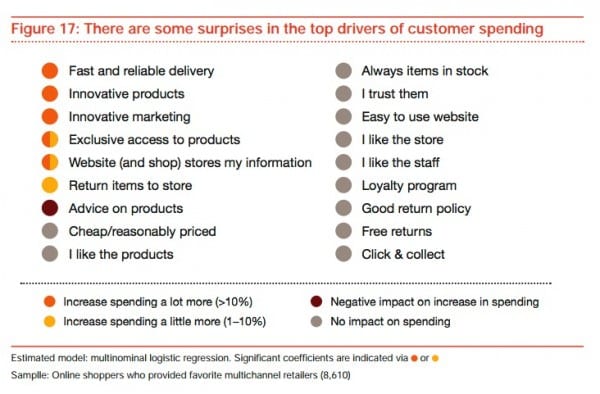
The preference for acquisition over retention does not come as a surprise if we look at statistics that say ‘70% of online shoppers use the Internet to make purchases because there are lower prices and better deals’ (Source: pwc).
But take a closer look at the same research; when asked about the drivers for multichannel purchases:
consumers said that they are looking for fast and reliable delivery, as well as innovative products or marketing. These seem to be the real factors that contribute towards increased spending (>10%). This is an actionable insight related with retention and not acquisition methods.
All insights need to be actionable in order to be implemented otherwise they are just theory. So, you need to survey your audience to find the drivers that really matter to them from this list. Are you too focused on the neutral factors rather than the differentiators? But if statistics say that consumers are price driven is that actually an insight to consider for your business? In the end you will follow whatever seems more appropriate to your business strategy. However statistics stating what seems obvious are not usually the best insights to follow.
For those companies who have already begun to tread the path of creating and implementing actionable insights, perhaps there is the need to re-examine the journey of qualitative insights.
There is nothing wrong with automation of processes in qualitative analysis if it precedes research. Unfortunately research doesn’t usually come first.
Soft data is hard to analyse
To listen to what your customers are saying means so much more than looking at a survey or big data from several touch points. People’s opinions are given most of the time as qualitative data (soft data) and not as quantitative data (hard data), but you can try and convert soft data into hard data to facilitate analysis.
Unfortunately most insights do not have a tag line attached and never will because they happen offline. Even in the online world, with a multitude of things that can be measured, there is so much going on that you will need an analyst to evaluate and interpret results based on assumptions, especially when it comes to analysing qualitative data.
This Smart Insight's blog post will give you some food for thought: 5 types of customer feedback tools you can use for a more customer-centred website and brand.
So how do you create a path that includes qualitative customer journeys?
By implementing certain steps in your organisation you can overcome the difficulty of creating and implementing actionable insights based on qualitative data. I will discuss each of these steps in future posts. Here is the first.
- The first step is to create a path that includes customer’s journeys.
I have been using my own qualitative framework since last year on all my e-commerce client projects. It has been exciting to see the amount of actionable insights you can get from it.
When doing a qualitative analysis one aspect I always have in mind is how to transform the data into a quantitative structure to facilitate interpretation. I have considered the best practices of RACE digital marketing improvement framework and the best practices from Google’s ZMOT framework for multichannel success as a basis for the path described in the 3 curves framework.
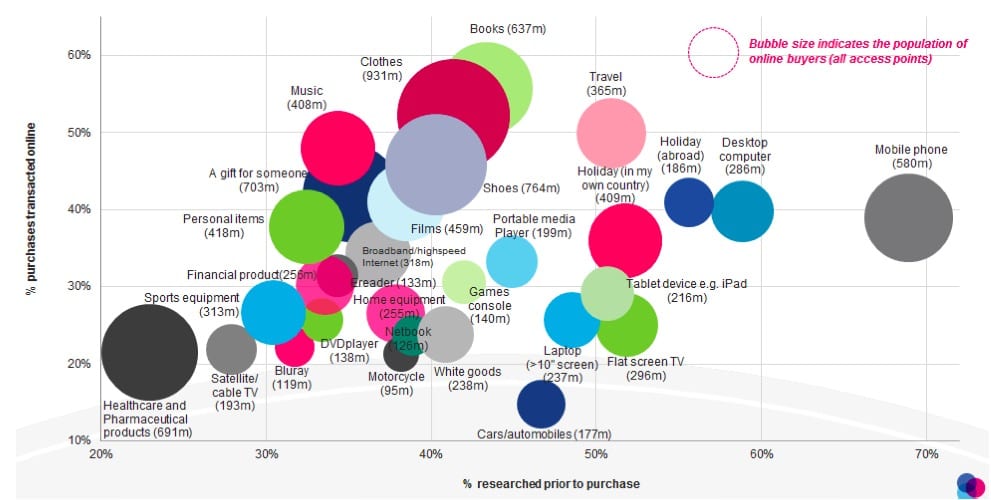
The propensity to buy online varies significantly by product type, so you have to start by taking this into account for a particular client. This chart shows the proportion of people who shopped for items by % researched online and % bought online (Source: Global Web Index). Most popular products researched online and bought online are books, clothes, shoes and travel - increasingly exclusively online.

How does the 3 curves framework work?
The 3 curves framework works more like a starting point to set up a routine business process that analyses qualitative data, for instance comments from reviews and social media.
It should be applied to mature industries on the web, similar to the ones previously stated. There is a need to adapt this framework to the specifics of the organisation being reviewed, as each organisation will have its own path.
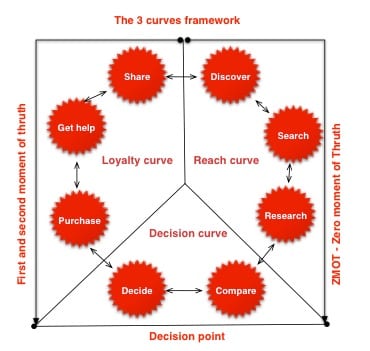
As shown in the figure above, each curve is a dimension that connects steps from the zero moment of truth; where the individual looks for information mainly online, to the first and second moment of truth; where the individual buys the product and uses it. In the middle is the decision point.
These are examples of techniques you can use at each stage if you decide to implement this 3 curves framework.
- Reach curve – You can get insights by telling stories using social media networks. You know that consumers will be trying to discover more about you, searching for solutions and researching both you and your competitors.If you create an # on Twitter to discuss interesting subjects for your customers you may be giving them enough information at this stage. The #ecomchat is a great example of how you can get the conversation going in a controlled environment
- Engagement curve – Insights at this stage may be provided by a map of behaviour on site. It is very useful to create personas and the user stories that each persona will be performing on the website. This is the type of analysis any commerce system implementer must do when scoping the website (frontend and backend).
- Loyalty curve – Between the get help phase and share, the consumer makes the decision to be happy or unhappy with what was bought so it is important to have a good customer service and software that collects reasons for the call. If you have a list of complaints you can then attribute a score to each one according to the categories they belong to.
Not all clients share their experiences though, regardless if they are good or bad. For the ones that do share, the cycle begins again, between the share and discover phase, although now with more knowledge. The consumer in this stage is capable of advocating his own opinion based on experience.
What framework is your organisation using for qualitative data? Please share your thoughts about this and any case studies you can think of.

Thanks to Maria Morais for her contribution to this post. Maria is a Digital Commerce Consultant with a deep understanding of enterprise alignment with the pace of change: from customer insights to product & service development. She regularly leads complex assignments involving research, data analysis, team structures, communities and business performance, to help brands and retailers make better-informed decisions in all areas relating to digital commerce. She is a regular contributor to various industry publications and blogs. You can follow her on
Twitter.