Practical tips to improve AdWords click volume and quality, particularly relevant for B2B and low volume B2C accounts
PPC traffic, in most accounts, have a very uneven distribution between the ad groups. What I find is that usually there are a few ad groups that get lots of traffic and then lots of long tail ad groups that each get a little bit of traffic.
This makes ad improvement tricky for the majority of ad groups. In order to improve ads we always run 2 or 3 ads in an ad group to see which one performs best over time and then optimise towards the best performer. So unless the ad groups ads have each had a high number of impressions and clicks then we cannot make a decision on which ad is performing best.
Fine for the few high traffic ad groups, but less easy for the majority of the ad groups.
This post shares a few hacks that can be made in order to get to decisions faster and optimise your PPC ads more quickly for better performance.
Traffic Distribution in Adwords Accounts
The chart below uses actual data from a retail client of ours, we just disguised the ad group names to protect their identity:
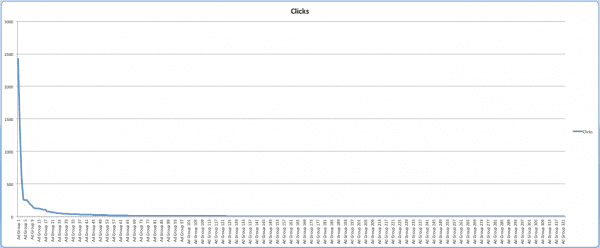
The data was collected over a month and shows that there were just a few (16) ad groups that received over 100 clicks and then lots (306) that received between 1 and 99 clicks.
Here is the distribution of clicks amongst the top 20 ad groups:
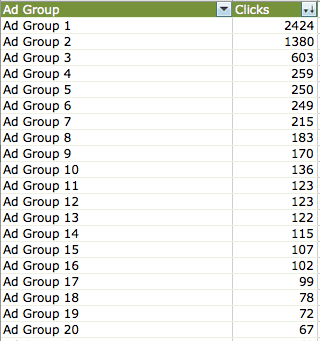
I am not saying that this is the same for all accounts but I do believe that it is pretty typical as most accounts that we have managed map pretty closely.
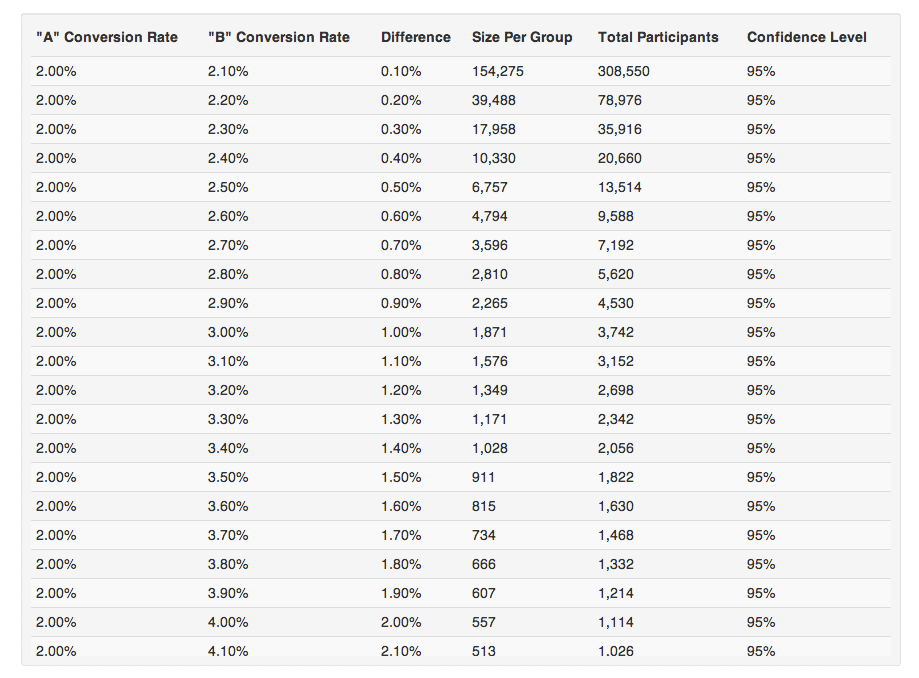
If you are running 2 ads in an ad group, so effectively an A/B test, you are likely to need more than 1000 impressions before you can determine a winner.
This table, represents the total impressions needed in order to determine a winner of an A/B test to a 95% confidence level. You can run various scenarios in the tool here.
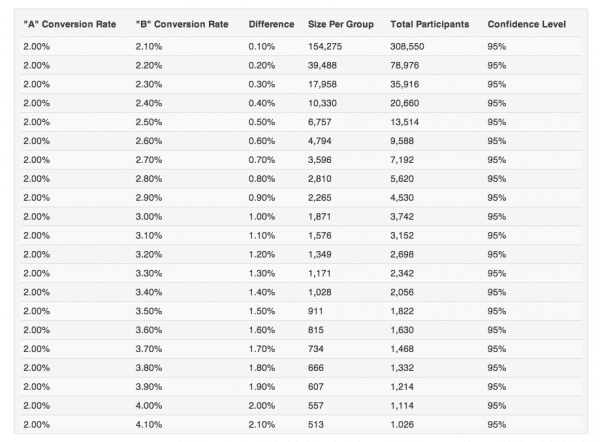
From the account we referred to above the average CTR is 4.91% on search ads so the figures get even higher - we need a minimum of 2000 impressions and 100 clicks across the 2 ads approx before we can determine a winner.
Over 1 month there were only 7 ad groups that hit this threshold. So what do we do with all of the long tail ad groups? Just leave them for a year and then have a check?
Aggregating Data
Most PPC accounts have common sense structures based on the company website or on the way people search for the product/service.
This means that you are likely to have ad groups that are very similar to each other - perhaps focusing on the same product or a very similar product.
This means that you can, with relative confidence, aggregate the data across multiple ad groups to identify weaknesses and strengths.
Calls to action
All PPC ads have a call to action and often this may be a common call to action used across multiple ad groups and even multiple campaigns.
e.g.
"Order Today for Free Delivery"
"10% Off When You Order Today"
If you use these calls to action across mutiple ad groups then you can use pivot tables in Excel to analyse them.
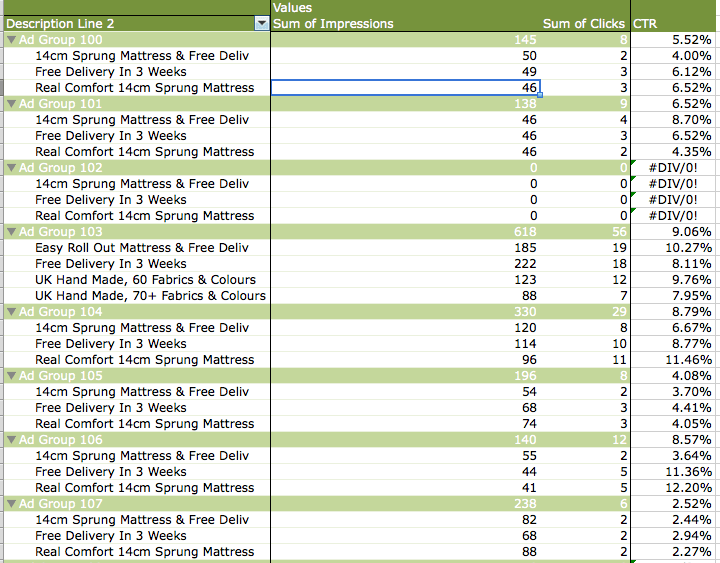
This screenshot shows a few ad groups from one campaign that is selling the same type of product:
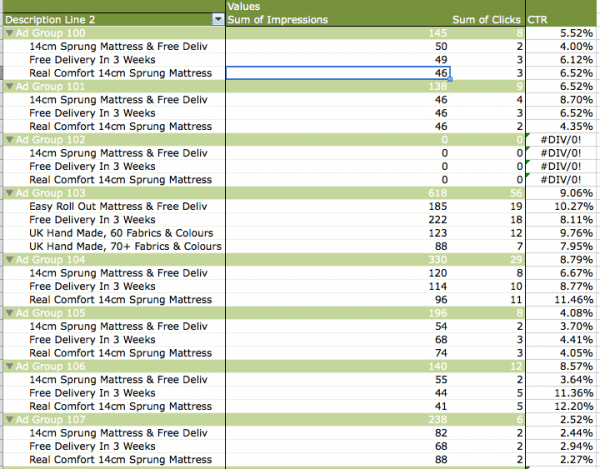
As you can see the ad groups share common description line 2 (which is often where the call to action is). here we are testing different aspects of the service:
- Delivery speed
- Product feature (mattress thickness)
- Product benefit (comfort)
- Combinations of the above 3.
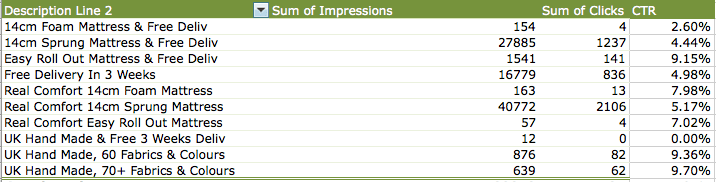
The results as you can see are very difficult to call like this, but by simply aggregating it across a whole campaign (takes 1 second in a pivot table) you can see some real performance indicators:
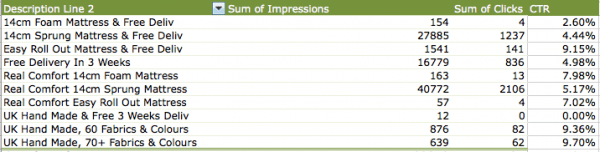
As you can see here it is obvious that the product features are more effective than delivery speed or the fact that delivery is free (at least in the ad).
You can then use this data to make changes en masse to the individual ad groups.
You can also see that although data collected is still small in volume it looks like "UK Hand Made" and also the number of fabric styles available are important to consumers so it may well be worth pushing more traffic to these description line 2's by using them in more ads.
*A word of warning - you should only use this technique across very similar products/services, never run it across a whole account that has multiple products or services.
Different products and services often have different customers with different priorities so you need to take this into consideration when planning your analysis.
I would love to hear of other techniques that people use to analyse ads effectively and of course if you have any questions then please leave them in the comments below.

Thanks to
Joel Chudleigh for sharing his advice and opinions in this post. Joel Chudleigh is CEO and Founder at
Deep Footprints, which is a digital agency focused on PPC and SEO through a holistic approach. That means that they really understand the need to know their clients' businesses and products/services inside out to understand how to best market them. You can follow him on
Twitter or connect on
LinkedIn.