Compare your traffic sources and mobile vs desktop audience split to others in your sector to make the business case for investment in digital marketing
Value: [rating=3]
Recommended link: Google Analytics Benchmarking announcement
Do you remember Google Analytics Benchmarking? You’ll need quite a good memory since Google withdrew it in late 2011 I recall - we lamented its passing in this post on using Google Analytics to Benchmark engagement with a site recommending how to use measures like bounce rate, pages per visit and visit duration to compare engagement with your site.
Well, now it’s back with a bang including a new interface and new types of reports. Here’s how to check it out:
How do I set up Benchmarking?
This is easy and you may well have it set up before. Head to Admin and check the second box shown.
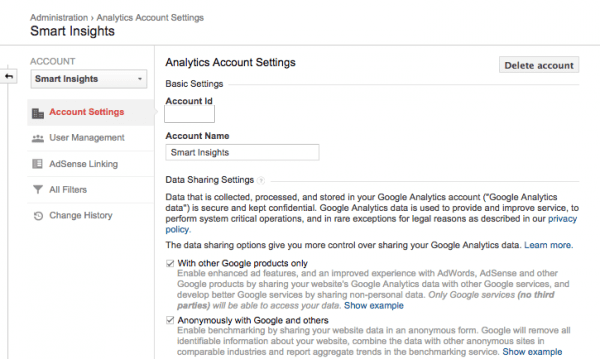
Data is shared anonymously, so there is no greater risk than having your data stored on Google already.
You also have to set up an Industry category to compare in the Properties Admin section on Google Analytics. Unlike previously, you don’t have to choose site size since Google automatically places businesses in different categories
Where do I find the reports?
These are under the Audience menu accessed via the Benchmarking option like so so:
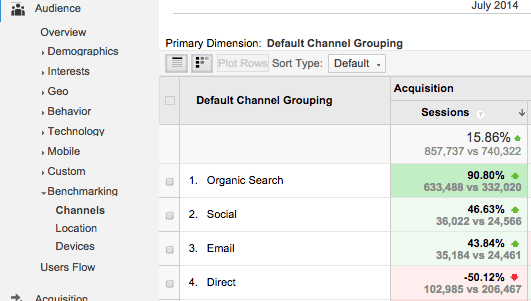
Which metrics are available to benchmark?
There are three reports, all of which can be give you some ammunition when making the case for investment in digital marketing:
- Channels - as shown above, this shows traffic volume (number of sessions), quality (bounce rate, page per session and duration and ). You can use these figures to justify more investment in marketing activities like SEO or AdWords.
- Locations - a breakdown by country - less useful for making the case for investment since location varies by where the business operates.
- Devices - this breaks down the visitors into desktop, tablet and mobile - so useful for showing how mobile use in your sector could change if you are receiving less than the sector average.
So what’s missing? As before, unfortunately, that’s all you get, so quite a lot of business critical KPIs are missing, for example around site conversion rates and value per visit such as revenue or goal value per visits.
Still, it's great to have this service back - thanks Google! Happy Benchmarking!


