Track and optimize these 5 metrics and watch your profits surge
As a digital marketer with access to Google Analytics plus your multiple inbound marketing tools, you have hundreds upon hundreds of metrics to consider while judging your results. Where to start? For example, here is just a tiny list of metrics to consider to start:
- Number of website visitors
- Website bounce rate
- Email subscriber list size
- Email open rate
- Advertising CTR (click-through rate)
- Number of new leads
Overwhelming... I know.
The natural question that arises is, which metrics are the most important to track, and why? This article will answer just that. I'll explain the 5 most critical metrics for your business, and how tracking them will boost your profits immediately.
Business Asset Metrics vs. Operating Metrics
Before we go over the 5 key metrics, I want to briefly explain the importance of Business Asset Metrics and Operating Metrics, and the difference between the two.
Operating Metrics are the numbers that gauge your current performance, such as sales, profits, website bounce rates, etc. On the other hand, Business Assets are resources you acquire or create that have future economic value, such as your email subscriber list.
Importantly, there is often a trade-off between the two. For example, if you spend $50,000 this month in advertising to acquire 10,000 new opt-ins/email addresses, your current month’s profits would decline by $50,000 (assuming none of the new subscribers bought anything right away). However, future sales and profits should increase due to the addition of new email subscribers.
So, when considering metrics, it’s critical to consider both types as this gives you both a short-term and long-term view of your business.
The Top 5 metrics to track
1. Number of New Leads
The first key metric to track is the number of new leads, or potential customers, you’re acquiring. The chart below shows the number of new leads by day, week, and month.
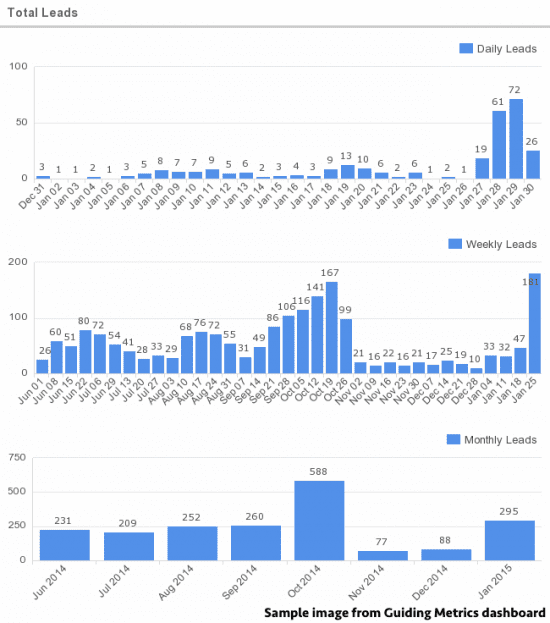
This metric is critical because leads are the lifeblood of your business. And if leads decrease today, sales decrease tomorrow. The challenge is that leads are different for type of business, so you have to identify these and customise goals in Google Analytics relevant to your business.
The problem is this: most businesses have no idea when leads go down since they don’t track them closely enough. Rather, they only notice a lead decrease days or weeks later when it’s too late and sales have already dropped.
I call this ’leaving money on the table.’ Had the business been tracking leads on a daily basis, the decrease would have been uncovered immediately. It would then have been evaluated with both business and emotional intelligence, the issue would be fixed and market-optimized, and sales would have increased rather than decreased.
2. Conversion Rate from Leads to Sales
The second key metric to track is your conversion rate from leads to sales.
Conversion Rate measures the process of transforming your leads into sales, which could be one or multiple steps. It is imperative to track your overall conversion rate from lead to sale, and, if you have multiple steps (e.g., talking to a sales rep, then receiving a proposal, etc.), measure the conversion rate for each one.
The chart below shows the conversion rate from leads to sales by day, week and month.
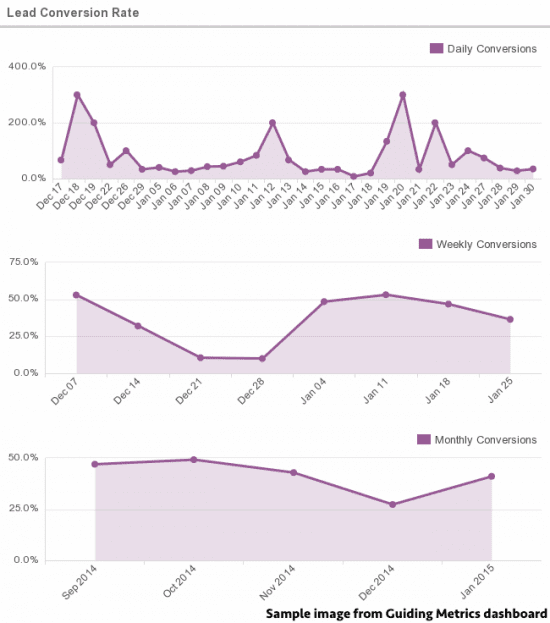
Once again, visibility is key here. I can’t even begin tell you how many businesses suffer weekly and monthly declines in their conversion rates from leads to sales because they simply aren’t aware of it.
You stop leaving money on the table and boost profits when you identify the conversion rate that’s declining, analyze it, and fix it. The adaptation process is typically accomplished by split testing different options until you find the winner (e.g., testing two different webinar registration pages).
A couple important notes here:
- The daily conversion rate in the chart above is sometimes above 100%. This is common and occurs when there is no uniformity between when leads come in and when they convert.
- For this reason among others, it’s important to view metrics on not just a daily, but weekly and monthly basis. This is true for all metrics, but particularly for conversion rates. There will always be variability on a daily basis, so you should typically view a single day’s performance with a grain of salt.
3. Cost Per Advertising Conversion
For most businesses, the most important advertising metric is cost per conversion.
Your cost per conversion is your advertising spend divided by whatever you set as the immediate conversion goal for your ad. For instance, the number of:
- phone calls received
- email addresses attained
- sales generated
- social media shares
The chart below shows the daily cost per conversion from a Facebook advertising campaign.
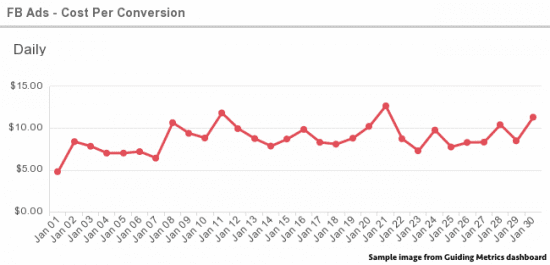
While metrics like cost per click are critical to monitor, cost per conversion is even much more so. For example, if you only pay $1 per click but only 10% of those who click convert, then your cost per conversion is $10. Conversely, if you pay five times as much per click ($5), but 80% convert, then your cost per conversion is only $6.25. Obviously we’d prefer the latter.
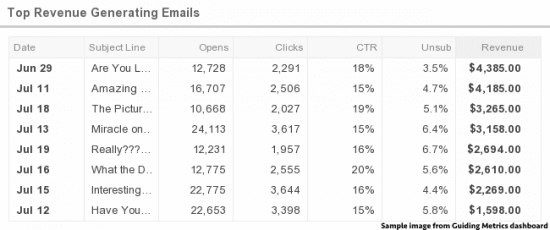
4. Top Converting Emails
While email metrics like open rates, click through rates and unsubscribe rates are important, the most critical metric to track is your total email conversions.
That is, how many email subscribers took the action you wanted? How many purchased your product or service, called you, or completed a form, etc.?
Once you identify these top converting emails, they become business assets. Since they’ve been proven successful, send them again in the future. Craft more like them. You’ve got some real ammo now.
While overall email conversions are the most important email metric, that’s not to say the other metrics should be ignored. For instance, if an email generated tons of sales, but also many unsubscribes, you might not want to blast that one again.
The chart below shows emails sorted in decreasing order of conversions. In this case, the metric decreases by revenue generated per email.
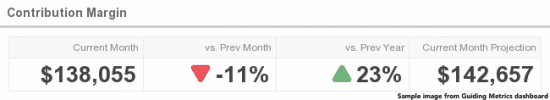
5. Contribution Margin
The most important metric that shows your operating results is your Net Profit, or your sales minus all your expenses. However, Net Profit is best viewed on a monthly basis. Why? Because calculating and subtracting the daily pro-rata cost of your office lease and salary expense isn’t exactly practical. Additionally, you don’t want the month to end only to learn then that profits had decreased.
As a result, the best approximation to Net Profit and the key metric you should be reviewing daily is your Contribution Margin. Contribution Margin equals your sales minus your variable costs, such as your costs of goods sold, advertising expenses, sales and/or affiliate commissions, and so on.
Contribution Margin is particularly critical for digital marketers since it’s so easy to increase sales by simply ramping up your online advertising spend. Moreover, this metric serves to ensure on a real-time basis that your company’s profits are strong.
Note: As shown in the chart below, Contribution Margin should be judged against prior periods. The goal is to always be increasing this crucial figure.
Recap: The Tangible Benefits of Tracking Your Metrics
By tracking and assessing your key metrics:
- You make more money. Period.
- You see what’s working and you know to do more of it. Leads converting? Let’s round up more leads. Blast a successful email? Awesome. Do it again.
- You save money. You’re alerted to problems immediately and can fix them right away.
- Your employee performance increases. When you let employees see select metrics, they tend to improve their performance since they’re finally being judged on an objective basis.
Bob Parsons, founder and CEO of GoDaddy, might have said it best when he advised, 'Measure everything of significance. Anything that is measured and watched, improves.'
At Guiding Metrics, we’ve been able to add one more key benefit to tracking your metrics: saving time. By integrating with the systems (web analytics, email systems, shopping carts, CRMs, etc.) where your data exists, and automatically pulling, organizing and assessing your metrics from it, the manual labor previously required to run your metrics is eliminated.
So make sure to start tracking your critical metrics today, and you can look forward to your performance consistently improving in the immediate future.

Thanks to
Dave Lavinsky for sharing their advice and opinions in this post. Dave Lavinsky is a serial entrepreneur and president of
Guiding Metrics, where he has helped hundreds of digital marketers to grow their sales and profits by automatically calculating their key metrics. Dave holds a BS from the University of Virginia and an MBA from The Anderson School of Management at UCLA. You can follow him on
Twitter or connect on
LinkedIn.


