Measure your brand's growth rate on social against the industry average
That social networks are still growing rapidly should come as no surprise. In 2014 a quarter of the world's population was active on social media, but by 2018 it is predicted a third of the world will be active. That is a massive increase of almost a billion new people in just 4 years.
The term 'fastest growing' can be defined in a number of ways. If you calculate it in percentage terms, then it will be the newer, smaller social networks that come out on top. For example, if the new social network 'Peach' went from having 10,000 to 100,000 followers in a year then it would have grown at 900%. By this measure, it would be faster growing than a more established network which had growth of 10 million users in a year, even though it had gained 9,900,000 less followers.
Another issue with looking at the 'fastest growing social network' is that sometimes it can lead marketers to chase the latest trends without actually assessing why they are on said social network. A good example is Snapchat. If Snapchat works for your business then great, but if you're offering a B2B product or if your brand is positioned to target older demographics then there really is very little point in rushing off to try and establish a presence on Snapchat. So for marketers, a more useful question to ask is, what is the fastest growing social network for brands?
That's where some new research from the good people at TrackMaven comes in. They looked at 26,965 brands across all industries, and established which networks the brands followings were growing fastest on.
They calculated the growth per network for each month in 2015, and map it out so you can see which networks brands are growing fastest on.
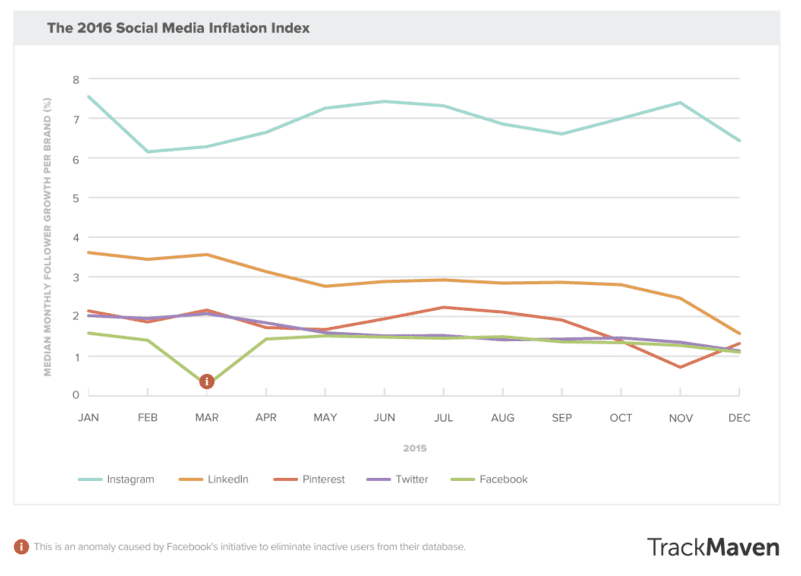
Instagram steals the show
Instagram consistently saw the highest rates of growth, with a whopping 7-8% monthly growth rate. Added up over the year that is absolutely explosive, and in 2015 the network outstripped Twitter, gaining more followers than the 10-year-old social network for the first time.
Over the whole year brands saw a whopping 100% follower growth on Instagram, showing how important it can be as a marketing platform. However, this explosive growth has come at a cost. Brand updates are now so common people's feeds were being overwhelmed, so Instagram has announced it will start trailing an algorithmic feed to combat this, much like Facebook currently does.
Annual trends
It is interesting to see how the growth rates changed over the course of last year. LinkedIn started very strongly but saw its's growth rate steadily decline, something we are likely to see this year as well as the network struggles to innovate. Pinterest's growth looked healthy in the summer but declined towards the end of the year, making it the slowest growing network for brands in 2015. On average brands saw 20% follower growth on Pinterest in 2016, whilst on average their follower growth across all the networks was an impressive 42%.
Benchmark your business
These stats provide a useful guide to how fast you should be expecting your branded social media accounts to be growing by. If you saw your Instagram double in followers this year you may be patting yourself on the back, but remember that is only the average performance for brands, and if you want to be outstripping the competition you need to be doing better.
Similarly, if you were slightly disappointed by Pinterest growth of only 30% this year despite investing resources in it, you can console yourself that at least you are beating the industry average of 20%.
The key takeaway is that you shouldn't be targeting just 'growth' on your brand's social networks, but you need to be setting targets for that growth, and those targets should reflect the fact that the competition's social accounts are also going to be gaining followers at an average rate of some 40% a year, so 40% is really just treading water.
We hope these stats are useful for evaluating your team's progress. If you organisation is a bit of a digital laggard they may be useful for evidence as to why you need to be developing a better strategy for social media.


