Be objective by using Business Intelligence
One of the most pertinent quotes about the data analytics industry was said by Jim Barksdale, former Netscape CEO: 'If we have data, let’s look at data. If all we have are opinions, let’s go with mine.' This strikes a chord in businesses, especially when it comes to strategizing and improving the user experience (UX) where perceptions of how good an online experience is, with all its benefits and constraints, is shaped by the personal backgrounds and expertise of many individuals within an industry. Developers, designers, and information architects will all come up with different critiques and directions to the same issue.
Business Intelligence is your only objective friend
Tapping into the power of BI as a way to improve user experience
BI and data analytics, on the other hand, give businesses fact-based assessments, numbers, and concrete correlations--serving as a trusty, objective counsel that allows you to learn more about your prospects, customers, campaigns and marketplace than ever before.
By allowing professionals to rely on quantitative-data to aid in research and design, BI has become the only reliable tool to determine usability and user experience.
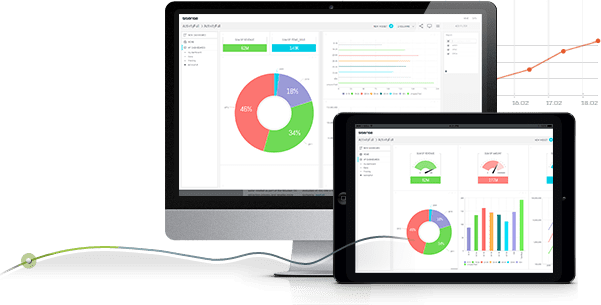
Its technical capabilities to analyze big data combined with flexible, shareable data visualizations in dashboards and reports that make insights pop out at business users make BI the best tool to inform UX and marketing tactics. This is why more businesses are tapping into the power of business intelligence as a tool to measure and improve the user experience.
Takeaway: BI is the only reliable tool for determining and measuring user experience and improving marketing tactics.
Digitization offers incredible opportunities
Companies that serve in the digital space can use BI to better measure and understand their users’ needs. While there are many different definitions of a user experience, when it comes to online industries such as retail and ecommerce, the number one goal is to find the most efficient way to meet the users needs.
With the digitization of the retail industry and it’s younger brother e-commerce, businesses have undergone massive changes in how users make purchases and what needs users have. While some users research online but prefer to buy in a brick and mortar store, others will never step foot into a store and buy completely online. Retail companies now depend on their online browsing and shopping experience to build long lasting relationships with their potential customers.
Facebook creates new ways to gather user data
As more users are served in the digital space, retailers have more opportunities to measure if their users’ needs are being met--giving online shopping industries incredible opportunities to gather data and measure the user experience.
Just a couple of months ago, even Facebook transformed itself into an online retail store by adding a 'Buy' button inside the News Feed posts and ads, letting users pay for goods and services without leaving Facebook website and thereby creating the perfect opportunity to gain data on customer behaviour.
Pay attention to the trail of data uses leave behind
Users are constantly creating valuable data- online browsing data, click through rates, social media behaviour, mobile usage, location data and more--that is just waiting for businesses to gather, analyze, and better understand the online experience.
Takeaway: Companies can gather and analyze the online browsing data that users create to get an accurate picture of their user experience.
Customer behaviour holds answers to your UX questions
Wix transformed the experience visitors encountered on their website using BI and dashboard software.
Wix, a successful cloud-based website development that is publicly traded on the NASDAQ, realized their business needed a big data BI solution when they were unable to collectively track their 50 million users and their large-scale data streams. This case study shows how they used our BI tool to develop a way to better understand the experience visitors encountered on their website, and began to differentiate between free and paid users in order to tailor a different user experience for each type of users need. For example, paid users want to easily find support forums and training, whereas prospects need to understand the very basics of what a product does.
Creating One Version of Truth in One Dashboard
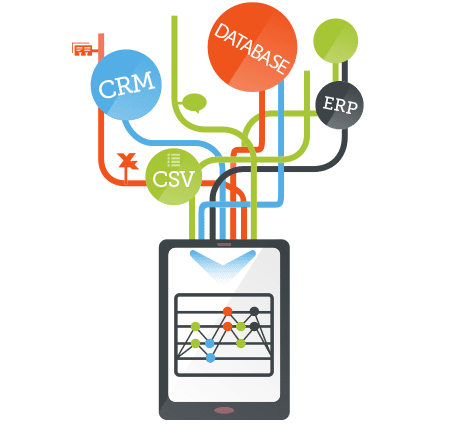
The company also used BI dashboard software to gather and join many different data sources, such as MS-SQL, Oracle and MySQL databases, Excel and CSV files, and direct API access to Google Adwords and Google Analytics data, in order to create a single repository of user data from which Wix builds reports and dashboards. Wix now easily charts activity across the site, reacts quickly to changes, and derives insight based on behavioural data from numerous sources.
Takeaway: BI dashboard software allows companies to chart website activity, react quickly to changes, and gain insight based on behavioural data from multiple sources.
4 reasons you need BI to measure UX
BI provides the technical infrastructure to allow businesses to combine large data sets in different formats and from multiple sources
As with the Wix example, the true challenge many industries face is finding meaningful insights from large data sets collected in different systems. In this way, business Intelligence answers their need because it is the provides the technical infrastructure to allow businesses to combine large data sets in different formats and from different sources, and freely analyze it. Here are four reasons why BI is the best tool to measure the user experience:
- 1. Combining all your data sources
If you want to understand the full experience of the user, you need to tie together data from all the systems the user touched in every step of the process, rather than analyzing each system’s data individually.
Different systems, such as a web tracking system, payment/billing system, and feedback system need to be joined together to produce one report from that combine data--revealing the most sophisticated and accurate insights. Only full stack BI infrastructure can provide the correct technology to combine large and disparate data sources easily, simply, and with accuracy.
- 2. Up-to-date tracking for continuous improvements
Businesses constantly make changes to their website or payment processing, and it’s important to be able to continuously track these changes in a report or dashboard in order to see the impact.
For example, if there are changes made to an ecommerce site’s billing details page, it is crucial to continuously track this process in order to see if this change impacted the completed transactions, fraud rates, etc. You can only measure the impact correctly by comparing results before and after a change with a BI dashboard that continues to keep an eye on complex processes and continuously syncs with new data.
- 3. Ability to explore and segment data
Allowing businesses to ask questions at the speed of thought is key to drilling down on specific areas in the user experience process. Businesses need to be able to easily slice and dice data to see different perspectives and be able to query the data without running back to IT every time additional questions are asked.
Full stack BI infrastructure allows you to store large data sets, explore that data, slice it, filter it, create new segments to track--all of which greatly improves your chances on making an unexpected discovery. Having independence to adapt and evolve your reports to investigate further without IT intervention will give you the flexibility and agility you need to be responsive to market and organizational needs.
 Different people have different specifications on what is important to measure about the user experience. Even just within a single department, such as the marketing department, content writers want to measure if the terminology is resonating with the audience, whereas a graphic designer wants to ensure the navigation is clear and being used properly.
In order to maximize improvements, you must be able to share your perspective with web-based, collaborative dashboards that are easy to use for business users to use so they can filter, drill-down, and add their own insight into the equation.
Takeaway: Joining multiple data sources, real-time monitoring, powerful data exploration, and shareable dashboards maximizes a company's ability to measure UX.
How to start measuring the user experience
Choosing the right BI tool with powerful technology and data visualization
Business departments such as marketing experts, UX teams, and more can truly benefit from making data-driven decisions using BI. The first step is to select a tool that provides users with a powerful back-end technology to handle multiple and large data sets, giving your organization a bird’s eye view of what’s going on across the entire organization, as well as powerful data exploration and visualization capabilities to create effective dashboards that measure the user experience
From there, users can select the scope of the data they want to investigate, both the breadth and depth of data, and leverage the power of the data source mash-up. These dashboards will be useful long after they are taken out of the conference room.
Copyright/Image: SiSense

Thanks to
Saar Bitner for sharing his advice and opinions in this post. With more than a decade of Marketing, Sales and Product Management experience, Saar Bitner is the VP Marketing at business analytics and dashboard software company,
SiSense and executes data driven strategies as he makes way for the massive growth taking place. SiSense is an award-winning business analytics and dashboard software known for its unique technology that lets non-techies easily analyze and visualize big data sets from multiple sources. You can follow Saar on
Twitter or connect on
LinkedIn.


